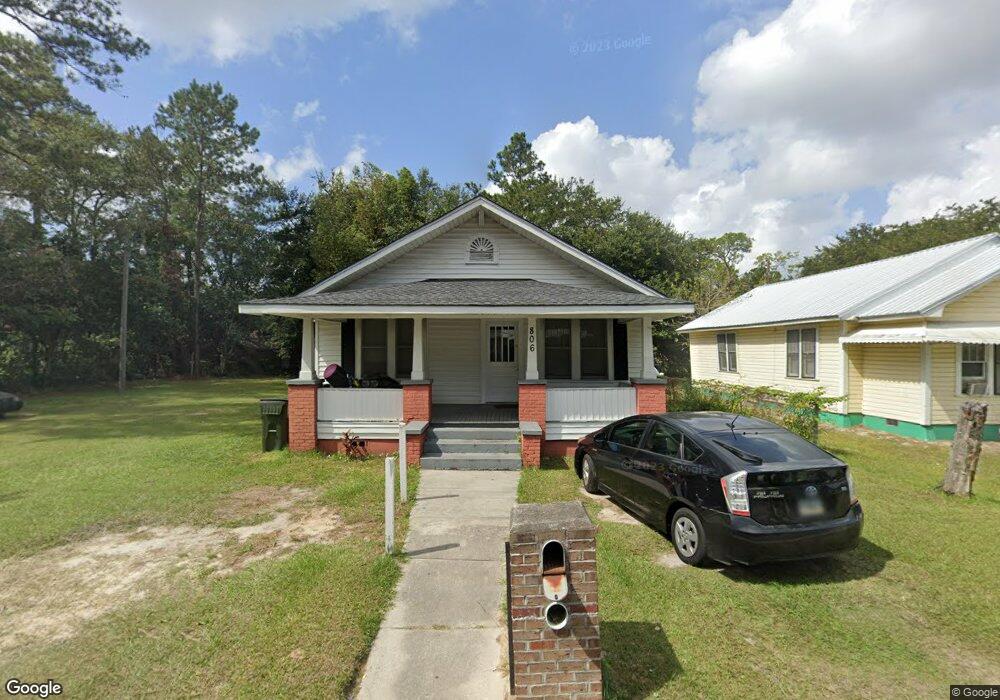
806 Blackwell St Waycross, GA 31501
Estimated Value: $67,000 - $143,000
3
Beds
2
Baths
1,176
Sq Ft
$86/Sq Ft
Est. Value
About This Home
This home is located at 806 Blackwell St, Waycross, GA 31501 and is currently estimated at $100,709, approximately $85 per square foot. 806 Blackwell St is a home located in Ware County with nearby schools including Memorial Drive Elementary School, Waycross Middle School, and Ware County High School.
Ownership History
Date
Name
Owned For
Owner Type
Purchase Details
Closed on
Aug 8, 2022
Sold by
R J Welch & Son Inc
Bought by
K R Welch Inc
Current Estimated Value
Purchase Details
Closed on
Jun 29, 2011
Sold by
Welch Lewis and Welch Lewis J
Bought by
R J Welch & Son Inc
Purchase Details
Closed on
Jul 15, 2009
Sold by
R J Welch & Son Inc
Bought by
Welch Lewis J
Purchase Details
Closed on
Sep 17, 2002
Sold by
Albertie Gloria
Bought by
Welch R J & Son Inc
Purchase Details
Closed on
Feb 21, 1989
Bought by
Albertie Gloria
Create a Home Valuation Report for This Property
The Home Valuation Report is an in-depth analysis detailing your home's value as well as a comparison with similar homes in the area
Home Values in the Area
Average Home Value in this Area
Purchase History
| Date | Buyer | Sale Price | Title Company |
|---|---|---|---|
| K R Welch Inc | -- | -- | |
| R J Welch & Son Inc | -- | -- | |
| Welch Lewis J | -- | -- | |
| Welch R J & Son Inc | $20,000 | -- | |
| Albertie Gloria | -- | -- |
Source: Public Records
Tax History Compared to Growth
Tax History
| Year | Tax Paid | Tax Assessment Tax Assessment Total Assessment is a certain percentage of the fair market value that is determined by local assessors to be the total taxable value of land and additions on the property. | Land | Improvement |
|---|---|---|---|---|
| 2024 | $869 | $25,208 | $2,170 | $23,038 |
| 2023 | $869 | $15,715 | $1,869 | $13,846 |
| 2022 | $626 | $15,715 | $1,869 | $13,846 |
| 2021 | $589 | $13,625 | $1,869 | $11,756 |
| 2020 | $583 | $13,380 | $1,869 | $11,511 |
| 2019 | $564 | $12,768 | $1,869 | $10,899 |
| 2018 | $543 | $12,156 | $1,869 | $10,287 |
| 2017 | $530 | $12,156 | $1,869 | $10,287 |
| 2016 | $530 | $12,156 | $1,869 | $10,287 |
| 2015 | $534 | $12,155 | $1,869 | $10,287 |
| 2014 | $533 | $12,156 | $1,869 | $10,287 |
| 2013 | -- | $14,078 | $1,868 | $12,209 |
Source: Public Records
Map
Nearby Homes