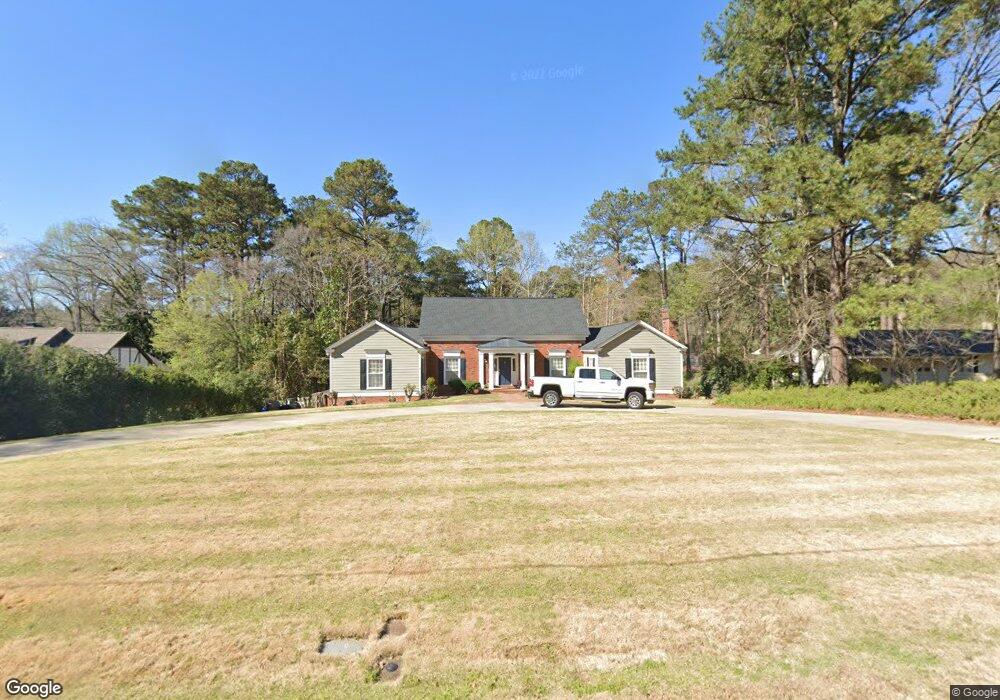
806 Camellia Dr Lagrange, GA 30240
Estimated Value: $538,689 - $602,000
5
Beds
5
Baths
4,680
Sq Ft
$122/Sq Ft
Est. Value
About This Home
This home is located at 806 Camellia Dr, Lagrange, GA 30240 and is currently estimated at $569,672, approximately $121 per square foot. 806 Camellia Dr is a home located in Troup County with nearby schools including Hollis Hand Elementary School, Franklin Forest Elementary School, and Ethel W. Kight Elementary School.
Ownership History
Date
Name
Owned For
Owner Type
Purchase Details
Closed on
Nov 2, 2016
Sold by
Yates David P
Bought by
Bateman Leonard H and Bateman Lisa C
Current Estimated Value
Home Financials for this Owner
Home Financials are based on the most recent Mortgage that was taken out on this home.
Original Mortgage
$258,875
Outstanding Balance
$207,832
Interest Rate
3.42%
Mortgage Type
New Conventional
Estimated Equity
$361,840
Purchase Details
Closed on
Jun 17, 1992
Sold by
Hogan
Bought by
Yates David P
Purchase Details
Closed on
Oct 2, 1989
Sold by
Renda Jerry and Renda Averett
Bought by
Hogan
Purchase Details
Closed on
Dec 20, 1983
Sold by
Jerry Averett Cont Inc
Bought by
Renda Jerry and Renda Averett
Purchase Details
Closed on
Aug 16, 1982
Sold by
Freeman T M
Bought by
Jerry Averett Cont Inc
Purchase Details
Closed on
Oct 6, 1975
Sold by
Langford Cont Inc
Bought by
Freeman T M
Purchase Details
Closed on
Sep 23, 1975
Sold by
Eugene R Langford
Bought by
Langford Cont Inc
Purchase Details
Closed on
Jun 9, 1975
Sold by
Robert Parker
Bought by
Eugene R Langford
Create a Home Valuation Report for This Property
The Home Valuation Report is an in-depth analysis detailing your home's value as well as a comparison with similar homes in the area
Home Values in the Area
Average Home Value in this Area
Purchase History
| Date | Buyer | Sale Price | Title Company |
|---|---|---|---|
| Bateman Leonard H | $272,500 | -- | |
| Yates David P | $265,000 | -- | |
| Hogan | $234,000 | -- | |
| Renda Jerry | -- | -- | |
| Jerry Averett Cont Inc | -- | -- | |
| Freeman T M | -- | -- | |
| Langford Cont Inc | -- | -- | |
| Eugene R Langford | -- | -- |
Source: Public Records
Mortgage History
| Date | Status | Borrower | Loan Amount |
|---|---|---|---|
| Open | Bateman Leonard H | $258,875 |
Source: Public Records
Tax History Compared to Growth
Tax History
| Year | Tax Paid | Tax Assessment Tax Assessment Total Assessment is a certain percentage of the fair market value that is determined by local assessors to be the total taxable value of land and additions on the property. | Land | Improvement |
|---|---|---|---|---|
| 2024 | $4,983 | $182,720 | $16,000 | $166,720 |
| 2023 | $4,739 | $173,760 | $16,000 | $157,760 |
| 2022 | $4,104 | $147,040 | $16,000 | $131,040 |
| 2021 | $3,610 | $119,680 | $16,000 | $103,680 |
| 2020 | $3,610 | $119,680 | $16,000 | $103,680 |
| 2019 | $3,706 | $122,880 | $16,000 | $106,880 |
| 2018 | $3,552 | $117,760 | $16,000 | $101,760 |
| 2017 | $3,287 | $119,000 | $16,000 | $103,000 |
| 2016 | $3,474 | $117,163 | $16,000 | $101,163 |
| 2015 | $3,480 | $117,163 | $16,000 | $101,163 |
| 2014 | $3,569 | $119,914 | $16,000 | $103,914 |
| 2013 | -- | $119,914 | $16,000 | $103,914 |
Source: Public Records
Map
Nearby Homes
- 203 S Chilton Crescent
- 201 S Chilton Crescent
- 724 Camellia Dr
- 106 S Chilton Crescent
- 102 Ewing St
- 106 Ewing St
- 748 Lakewood Dr
- 100 Creekside Dr Unit LOT 60A
- 145 Turner St
- 107 Dixie Creek Dr
- 204 Colonial St
- 110 Russell St
- 900 North St
- 806 New Franklin Rd
- 109 Thomas St
- 705 Piney Woods Dr
- 114 Briarcliff Rd
- 219 Banks St
- 603 Country Club Rd
- 609 Cherokee Rd
- 808 Camellia Dr
- 804 Camellia Dr
- 209 Chesterfield Place
- 802 Camellia Dr
- 205 Chesterfield Place
- 810 Camellia Dr Unit 182
- 810 Camellia Dr
- 207 Chesterfield Place
- 807 Camellia Dr
- 809 Camellia Dr
- 212 Chesterfield Place
- 208 Chesterfield Place
- 0 Chesterfield Place Unit 7495171
- 0 Chesterfield Place Unit 7408603
- 210 Chesterfield Place
- 803 Camellia Dr
- 800 Camellia Dr
- 812 Camellia Dr
- 305 Ivydale Dr
- 201 Chesterfield Place