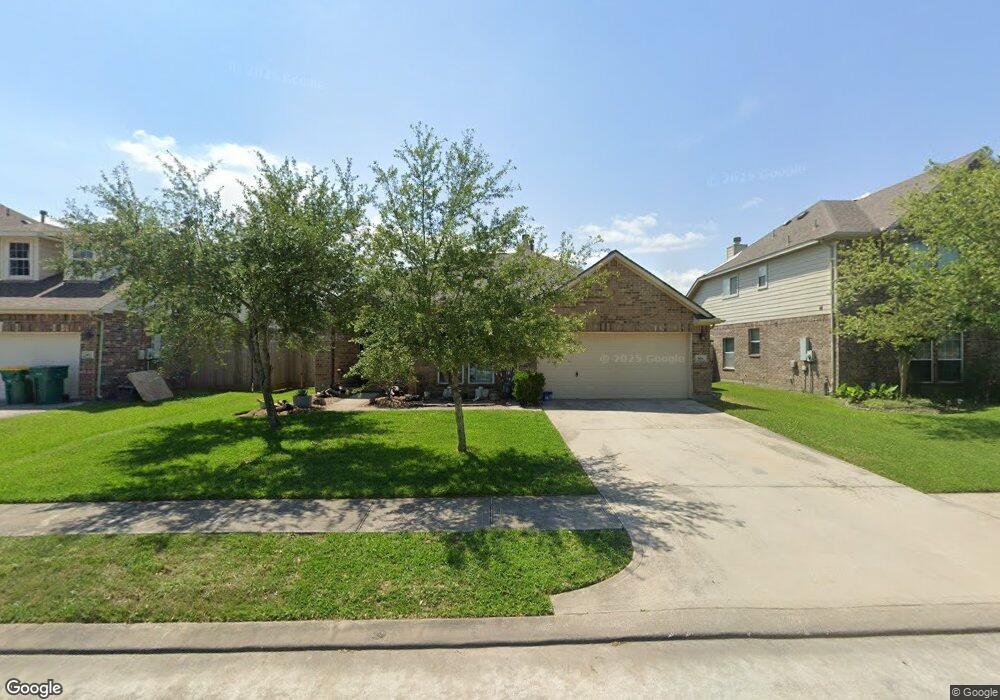
806 Corner Square Seabrook, TX 77586
Estimated Value: $345,640 - $361,000
3
Beds
2
Baths
1,885
Sq Ft
$188/Sq Ft
Est. Value
About This Home
This home is located at 806 Corner Square, Seabrook, TX 77586 and is currently estimated at $355,160, approximately $188 per square foot. 806 Corner Square is a home located in Harris County with nearby schools including Bay Elementary School, Seabrook Intermediate School, and Clear Falls High School.
Ownership History
Date
Name
Owned For
Owner Type
Purchase Details
Closed on
Jun 25, 2012
Sold by
Searidge Investments Lp
Bought by
Bayway Homes Inc
Current Estimated Value
Home Financials for this Owner
Home Financials are based on the most recent Mortgage that was taken out on this home.
Original Mortgage
$160,200
Outstanding Balance
$110,868
Interest Rate
3.8%
Mortgage Type
Purchase Money Mortgage
Estimated Equity
$244,292
Purchase Details
Closed on
Sep 15, 2011
Sold by
Bayway Homes Incorporated
Bought by
Seamend Angela M and Frock Daniel E
Home Financials for this Owner
Home Financials are based on the most recent Mortgage that was taken out on this home.
Original Mortgage
$163,741
Interest Rate
4.43%
Mortgage Type
FHA
Purchase Details
Closed on
Apr 5, 2011
Sold by
Searidge Investments Lp
Bought by
Bayway Homes Incorporated
Home Financials for this Owner
Home Financials are based on the most recent Mortgage that was taken out on this home.
Original Mortgage
$111,520
Interest Rate
4.98%
Mortgage Type
Purchase Money Mortgage
Create a Home Valuation Report for This Property
The Home Valuation Report is an in-depth analysis detailing your home's value as well as a comparison with similar homes in the area
Home Values in the Area
Average Home Value in this Area
Purchase History
| Date | Buyer | Sale Price | Title Company |
|---|---|---|---|
| Bayway Homes Inc | -- | American Title Company | |
| Seamend Angela M | -- | Texas American Title Company | |
| Bayway Homes Incorporated | -- | Etc |
Source: Public Records
Mortgage History
| Date | Status | Borrower | Loan Amount |
|---|---|---|---|
| Open | Bayway Homes Inc | $160,200 | |
| Previous Owner | Seamend Angela M | $163,741 | |
| Previous Owner | Bayway Homes Incorporated | $111,520 |
Source: Public Records
Tax History
| Year | Tax Paid | Tax Assessment Tax Assessment Total Assessment is a certain percentage of the fair market value that is determined by local assessors to be the total taxable value of land and additions on the property. | Land | Improvement |
|---|---|---|---|---|
| 2025 | $5,224 | $369,404 | $72,384 | $297,020 |
| 2024 | $5,224 | $356,544 | $72,384 | $284,160 |
| 2023 | $5,224 | $384,674 | $72,384 | $312,290 |
| 2022 | $6,143 | $321,233 | $72,384 | $248,849 |
| 2021 | $6,015 | $286,658 | $63,610 | $223,048 |
| 2020 | $5,918 | $238,740 | $50,618 | $188,122 |
| 2019 | $6,177 | $238,740 | $50,618 | $188,122 |
| 2018 | $2,197 | $231,340 | $38,620 | $192,720 |
| 2017 | $5,881 | $226,146 | $38,620 | $187,526 |
| 2016 | $5,742 | $220,797 | $38,620 | $182,177 |
| 2015 | $4,106 | $210,396 | $32,246 | $178,150 |
| 2014 | $4,106 | $183,599 | $32,246 | $151,353 |
Source: Public Records
Map
Nearby Homes
- 817 Dawn Ridge Way
- 1205 Cambridge Ct
- 1018 E Meyer Rd
- 1210 Cambridge Ct
- 806 Dawn Ridge Way
- 1502 N Meyer Rd
- 1313 Plymouth Rock Ln
- 1225 Friendship Trail
- 937 Mystic Village Ln
- 0 Oak Alley Ct Unit 61117265
- 1013 Victorian Ct
- 702 E Meyer Rd
- 3309 Todville Rd
- 1133 E Meyer Rd
- 1221 Friendship Trail
- 541 Villa Dr
- 538 Villa Dr
- 637 Bay Vista Dr
- 1816 - TBDT Todville Rd
- 1818 - 1820 Todville Rd
- 810 Corner Square
- 802 Corner Square
- 805 Irish Maple St
- 814 Corner Square
- 809 Irish Maple St
- 801 Irish Maple St
- 805 Corner Square
- 813 Irish Maple St
- 809 Corner Square
- 801 Corner Square
- 818 Corner Square
- 1106 Bay Sky Way
- 813 Corner Square
- 1102 Bay Sky Way
- 817 Irish Maple St
- 1110 Bay Sky Way
- 1042 Bay Sky Way
- 1114 Bay Sky Way
- 817 Corner Square
- 1038 Bay Sky Way
Your Personal Tour Guide
Ask me questions while you tour the home.