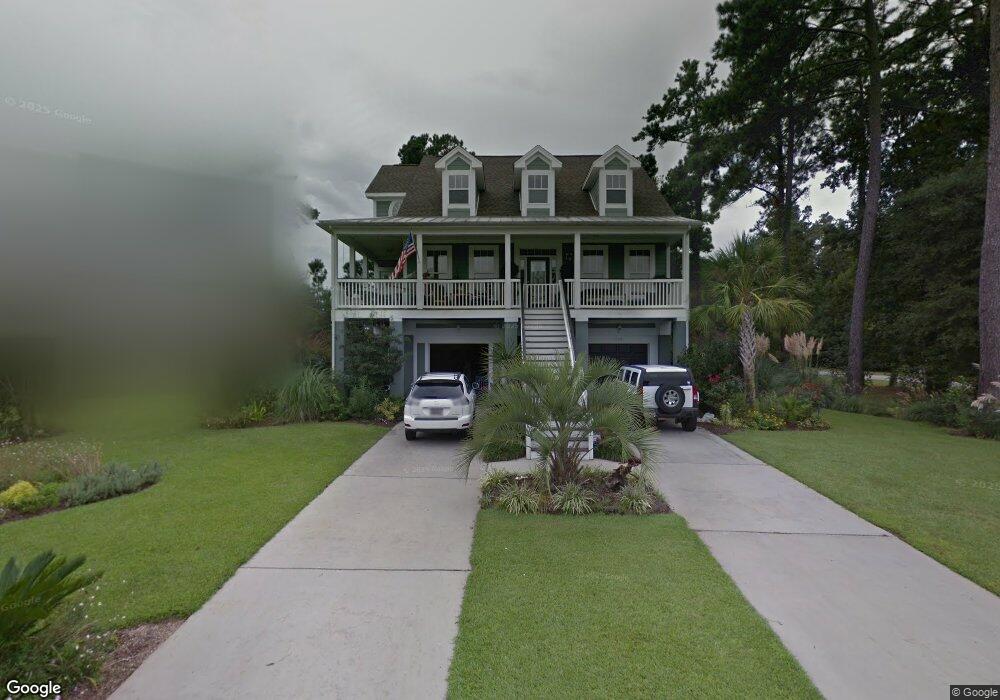
806 Falkirk St Myrtle Beach, SC 29579
Estimated Value: $561,000 - $654,000
4
Beds
4
Baths
5,690
Sq Ft
$107/Sq Ft
Est. Value
About This Home
This home is located at 806 Falkirk St, Myrtle Beach, SC 29579 and is currently estimated at $610,531, approximately $107 per square foot. 806 Falkirk St is a home located in Horry County with nearby schools including River Oaks Elementary School, Ten Oaks Middle, and Carolina Forest High School.
Ownership History
Date
Name
Owned For
Owner Type
Purchase Details
Closed on
Mar 15, 2022
Sold by
Sakala Constance S
Bought by
Sakala Constance and Seifert Katherine Piper
Current Estimated Value
Purchase Details
Closed on
Nov 4, 2016
Sold by
Sakala John H
Bought by
Sakala John H and Sakala Constance S
Home Financials for this Owner
Home Financials are based on the most recent Mortgage that was taken out on this home.
Original Mortgage
$272,000
Interest Rate
3.42%
Mortgage Type
New Conventional
Purchase Details
Closed on
Feb 19, 2010
Sold by
Greenway Misty C
Bought by
Sakala John H
Purchase Details
Closed on
Jul 27, 2007
Sold by
D R Horton Inc
Bought by
Greenway Misty C
Home Financials for this Owner
Home Financials are based on the most recent Mortgage that was taken out on this home.
Original Mortgage
$74,985
Interest Rate
6.63%
Mortgage Type
Credit Line Revolving
Purchase Details
Closed on
Oct 26, 2005
Sold by
Limestone Properties Llc
Bought by
D R Horton Inc
Create a Home Valuation Report for This Property
The Home Valuation Report is an in-depth analysis detailing your home's value as well as a comparison with similar homes in the area
Home Values in the Area
Average Home Value in this Area
Purchase History
| Date | Buyer | Sale Price | Title Company |
|---|---|---|---|
| Sakala Constance | -- | -- | |
| Sakala John H | -- | -- | |
| Sakala John H | $302,000 | -- | |
| Greenway Misty C | $499,900 | Attorney | |
| D R Horton Inc | $1,937,500 | -- |
Source: Public Records
Mortgage History
| Date | Status | Borrower | Loan Amount |
|---|---|---|---|
| Previous Owner | Sakala John H | $272,000 | |
| Previous Owner | Greenway Misty C | $74,985 | |
| Previous Owner | Greenway Misty C | $399,920 |
Source: Public Records
Tax History Compared to Growth
Tax History
| Year | Tax Paid | Tax Assessment Tax Assessment Total Assessment is a certain percentage of the fair market value that is determined by local assessors to be the total taxable value of land and additions on the property. | Land | Improvement |
|---|---|---|---|---|
| 2024 | -- | $22,633 | $5,275 | $17,358 |
| 2023 | $2,126 | $16,361 | $2,759 | $13,602 |
| 2021 | $1,448 | $16,642 | $2,814 | $13,828 |
| 2020 | $1,294 | $16,642 | $2,814 | $13,828 |
| 2019 | $1,294 | $16,642 | $2,814 | $13,828 |
| 2018 | $0 | $14,227 | $2,355 | $11,872 |
| 2017 | $1,125 | $14,227 | $2,355 | $11,872 |
| 2016 | -- | $14,227 | $2,355 | $11,872 |
| 2015 | $1,070 | $14,227 | $2,355 | $11,872 |
| 2014 | $986 | $14,227 | $2,355 | $11,872 |
Source: Public Records
Map
Nearby Homes
- 636 Barona Dr
- 600 Barona Dr
- 668 Barona Dr
- 125 Lac Courte
- 673 Tidal Point Ln
- 424 Pomo Dr
- 330 Mesa Grande Dr
- 257 Venice Way Unit H204
- 257 Venice Way Unit 2201 Lauderdale Bay
- 257 Venice Way Unit H101
- 265 Venice Way Unit I105
- 265 Venice Way Unit I303
- 265 Venice Way Unit 1101
- 265 Venice Way Unit 1-404
- 1224 Safe Haven Dr
- 249 Venice Way Unit 3301
- 249 Venice Way Unit 3105 Lauderdale Bay
- 514 Harbour View Dr
- 556 Dania Beach Dr
- 695 Riverwalk Dr Unit 5-302
- 800 Falkirk St
- 814 Falkirk St
- 814 Falkirk St Unit Villages of Arrowhea
- 822 Falkirk St Unit Arrowhead - Limeston
- 822 Falkirk St
- 809 Falkirk St
- 813 Falkirk St
- 802 Falkirk St
- 805 Falkirk St
- 826 Falkirk St
- 826 Falkirk St Unit Lot 43 - Cloisters A
- 210 Abcaw Blvd Unit MB
- 830 Falkirk St
- 821 Falkirk St
- 821 Falkirk St Unit Lot 27-Cumberland Pl
- 821 Falkirk St Unit Lot 27 - Willow Oak
- 206 Abcaw Blvd Unit "LIMESTONE"
- 206 Abcaw Blvd Unit MB
- 199 Abcaw Blvd
- 825 Falkirk St