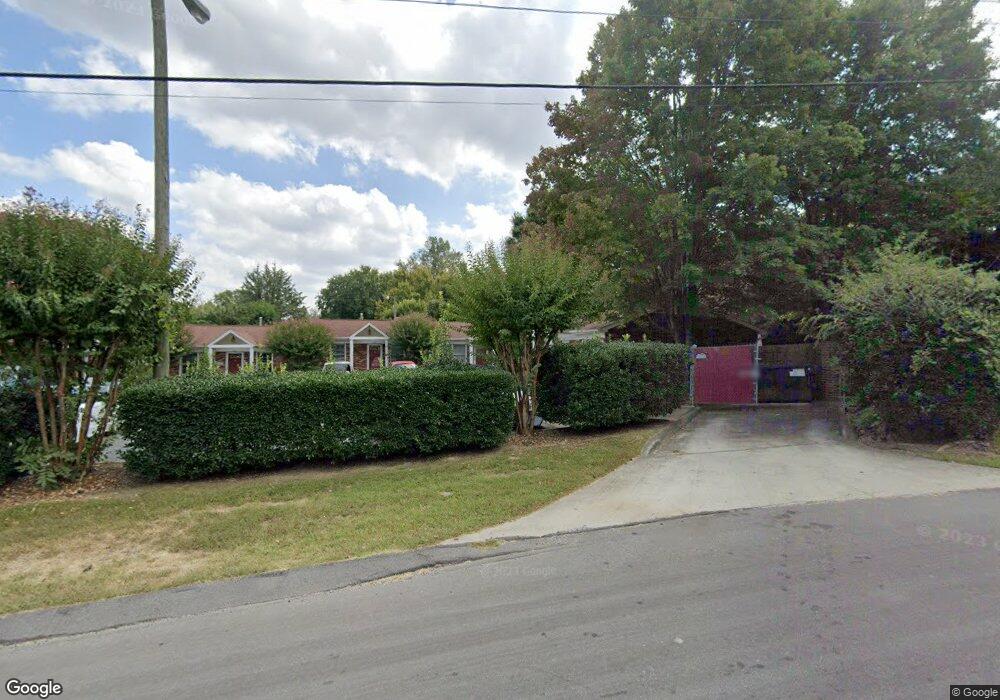
806 Floyd Ln Unit 4 Gastonia, NC 28052
Estimated Value: $124,000 - $202,000
2
Beds
1
Bath
624
Sq Ft
$247/Sq Ft
Est. Value
About This Home
This home is located at 806 Floyd Ln Unit 4, Gastonia, NC 28052 and is currently estimated at $154,372, approximately $247 per square foot. 806 Floyd Ln Unit 4 is a home located in Gaston County with nearby schools including Pleasant Ridge Elementary School, York Chester Middle School, and Hunter Huss High School.
Ownership History
Date
Name
Owned For
Owner Type
Purchase Details
Closed on
Jun 5, 2008
Sold by
Sherrill Norma M
Bought by
Mcvickers Carolyn
Current Estimated Value
Purchase Details
Closed on
Sep 2, 2005
Sold by
Mills Lorenzo C and Mills Doreatha M
Bought by
Sherrill Norma M
Home Financials for this Owner
Home Financials are based on the most recent Mortgage that was taken out on this home.
Original Mortgage
$44,000
Interest Rate
5.71%
Mortgage Type
Fannie Mae Freddie Mac
Purchase Details
Closed on
Jul 23, 2003
Sold by
Hansell David E and Hansell Alice A
Bought by
Mills Lorenzo C and Mills Doreatha M
Home Financials for this Owner
Home Financials are based on the most recent Mortgage that was taken out on this home.
Original Mortgage
$41,040
Interest Rate
5.16%
Mortgage Type
Purchase Money Mortgage
Purchase Details
Closed on
Jan 26, 1999
Sold by
City Of Gastonia
Bought by
Hansell David E and Hansell Alice A
Create a Home Valuation Report for This Property
The Home Valuation Report is an in-depth analysis detailing your home's value as well as a comparison with similar homes in the area
Home Values in the Area
Average Home Value in this Area
Purchase History
| Date | Buyer | Sale Price | Title Company |
|---|---|---|---|
| Mcvickers Carolyn | $64,000 | None Available | |
| Sherrill Norma M | $55,000 | -- | |
| Mills Lorenzo C | $51,500 | -- | |
| Hansell David E | $47,000 | -- |
Source: Public Records
Mortgage History
| Date | Status | Borrower | Loan Amount |
|---|---|---|---|
| Previous Owner | Sherrill Norma M | $44,000 | |
| Previous Owner | Mills Lorenzo C | $41,040 | |
| Previous Owner | Mills Lorenzo C | $10,260 |
Source: Public Records
Tax History Compared to Growth
Tax History
| Year | Tax Paid | Tax Assessment Tax Assessment Total Assessment is a certain percentage of the fair market value that is determined by local assessors to be the total taxable value of land and additions on the property. | Land | Improvement |
|---|---|---|---|---|
| 2025 | $583 | $109,000 | $6,000 | $103,000 |
| 2024 | $583 | $109,000 | $6,000 | $103,000 |
| 2023 | $589 | $109,000 | $6,000 | $103,000 |
| 2022 | $465 | $69,900 | $5,000 | $64,900 |
| 2021 | $472 | $69,900 | $5,000 | $64,900 |
| 2019 | $475 | $69,900 | $5,000 | $64,900 |
| 2018 | $377 | $61,715 | $10,000 | $51,715 |
| 2017 | $378 | $61,715 | $10,000 | $51,715 |
| 2016 | $379 | $61,715 | $0 | $0 |
| 2014 | $861 | $61,482 | $10,000 | $51,482 |
Source: Public Records
Map
Nearby Homes
- 804 Floyd Ln Unit 3
- 808 Floyd Ln Unit 5
- 802 Floyd Ln Unit 2
- 810 Floyd Ln Unit 6
- 800 Floyd Ln Unit 1
- 1127 W 7th Ave
- 1020 Westwynn Cir
- 1125 W 7th Ave
- 1130 W 7th Ave
- 809 Floyd Ln
- 1018 Westwynn Cir
- 819 Floyd Ln
- 1019 Westwynn Cir
- 815 Floyd Ln
- 1123 W 7th Ave
- N/A 7th Ave
- 821 Floyd Ln
- 1124 W 7th Ave
- 1012 Westwynn Cir
- 1119 W 7th Ave