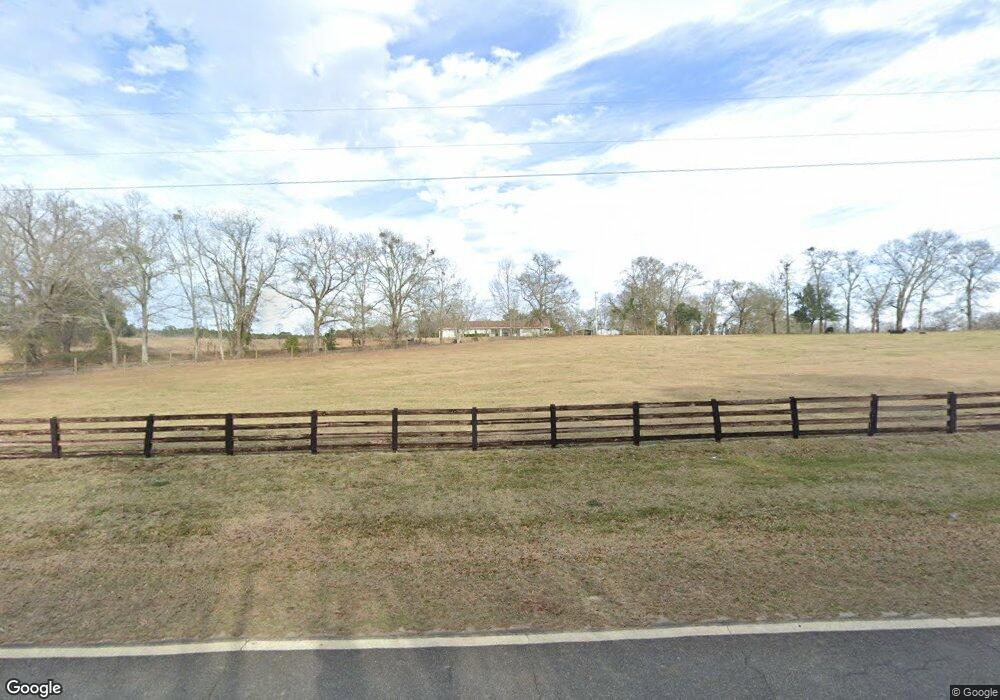
806 George Davis Rd Uvalda, GA 30473
Estimated Value: $191,287 - $214,000
--
Bed
2
Baths
2,382
Sq Ft
$86/Sq Ft
Est. Value
About This Home
This home is located at 806 George Davis Rd, Uvalda, GA 30473 and is currently estimated at $204,322, approximately $85 per square foot. 806 George Davis Rd is a home located in Toombs County with nearby schools including Toombs County High School.
Ownership History
Date
Name
Owned For
Owner Type
Purchase Details
Closed on
Apr 6, 2022
Sold by
Claxton Mickey B
Bought by
Glass Brandy and Glass Ramon
Current Estimated Value
Home Financials for this Owner
Home Financials are based on the most recent Mortgage that was taken out on this home.
Original Mortgage
$150,081
Outstanding Balance
$140,225
Interest Rate
3.76%
Mortgage Type
FHA
Estimated Equity
$64,097
Purchase Details
Closed on
Jul 30, 2018
Sold by
Williams Brenden C
Bought by
Claxton Mickey B
Purchase Details
Closed on
Sep 26, 2014
Sold by
Williams Ashley
Bought by
Williams Branden C and Williams Casey M
Home Financials for this Owner
Home Financials are based on the most recent Mortgage that was taken out on this home.
Original Mortgage
$96,921
Interest Rate
4.16%
Mortgage Type
FHA
Purchase Details
Closed on
Jun 12, 2014
Sold by
Williams Mary M
Bought by
Williams Ashley
Purchase Details
Closed on
Jun 17, 1999
Sold by
Williams Mary M
Bought by
Williams Mary M
Create a Home Valuation Report for This Property
The Home Valuation Report is an in-depth analysis detailing your home's value as well as a comparison with similar homes in the area
Home Values in the Area
Average Home Value in this Area
Purchase History
| Date | Buyer | Sale Price | Title Company |
|---|---|---|---|
| Glass Brandy | $152,900 | -- | |
| Claxton Mickey B | $122,400 | -- | |
| Williams Branden C | $98,170 | -- | |
| Williams Ashley | -- | -- | |
| Williams Mary M | -- | -- |
Source: Public Records
Mortgage History
| Date | Status | Borrower | Loan Amount |
|---|---|---|---|
| Open | Glass Brandy | $150,081 | |
| Previous Owner | Williams Branden C | $96,921 |
Source: Public Records
Tax History Compared to Growth
Tax History
| Year | Tax Paid | Tax Assessment Tax Assessment Total Assessment is a certain percentage of the fair market value that is determined by local assessors to be the total taxable value of land and additions on the property. | Land | Improvement |
|---|---|---|---|---|
| 2024 | $1,638 | $72,242 | $7,008 | $65,234 |
| 2023 | $1,432 | $69,422 | $7,008 | $62,414 |
| 2022 | $1,425 | $60,868 | $4,380 | $56,488 |
| 2021 | $1,212 | $50,344 | $4,380 | $45,964 |
| 2020 | $1,171 | $47,532 | $3,576 | $43,956 |
| 2019 | $840 | $37,197 | $3,576 | $33,621 |
| 2018 | $878 | $37,197 | $3,576 | $33,621 |
| 2017 | $833 | $35,133 | $3,576 | $31,557 |
| 2016 | $833 | $35,133 | $3,576 | $31,557 |
| 2015 | -- | $25,092 | $2,400 | $22,692 |
| 2014 | -- | $25,027 | $2,400 | $22,627 |
Source: Public Records
Map
Nearby Homes
- 0 Smyrna Rd Unit 10645048
- 0 Smyrna Rd Unit 23816
- 789 B Hitchcock Rd
- 5407 U S 221
- 5223 Georgia 135
- 274 Cedarwood Subdivision Rd
- 00 Georgia 135
- 674 McNatt Falls Rd
- 496 Grays Landing Rd
- 0 Gray's Landing Rd Unit 23834
- 0 Gray's Landing Rd Unit 10647341
- 1686 Georgia 56
- 298 Bud Denton Rd
- 347 Benton Powell Rd
- 346 Collie Williams Rd
- 0 Dead River Rd Unit 22915185
- 143 Sadie Galbreath Rd
- 0 Us Highway 1 Unit 10526168
- 3242 Cedar Crossing Vidalia Rd
- 105 Lonnie Johnson Rd
- 922 George Davis Rd
- 3877 Ga Highway 56 W
- 3917 Ga Highway 56 W
- 823 George Davis Rd
- 1100 George Davis Rd
- 4213 Ga Highway 56 W
- 4213 Georgia 56
- 763 George Davis Rd
- 1105 George Davis Rd
- 3896 Ga Highway 56 W
- 750 Ga Highway 56
- 4352 Ga Highway 56 W
- 4352 Georgia 56
- 4324 Ga Highway 56 W
- 864 Ga Highway 56
- 3584 Ga Highway 56 W
- 809 Ga Highway 56
- 809 Ga Highway 56
- 296 George Davis Rd
- 245 Dr Pittman Rd