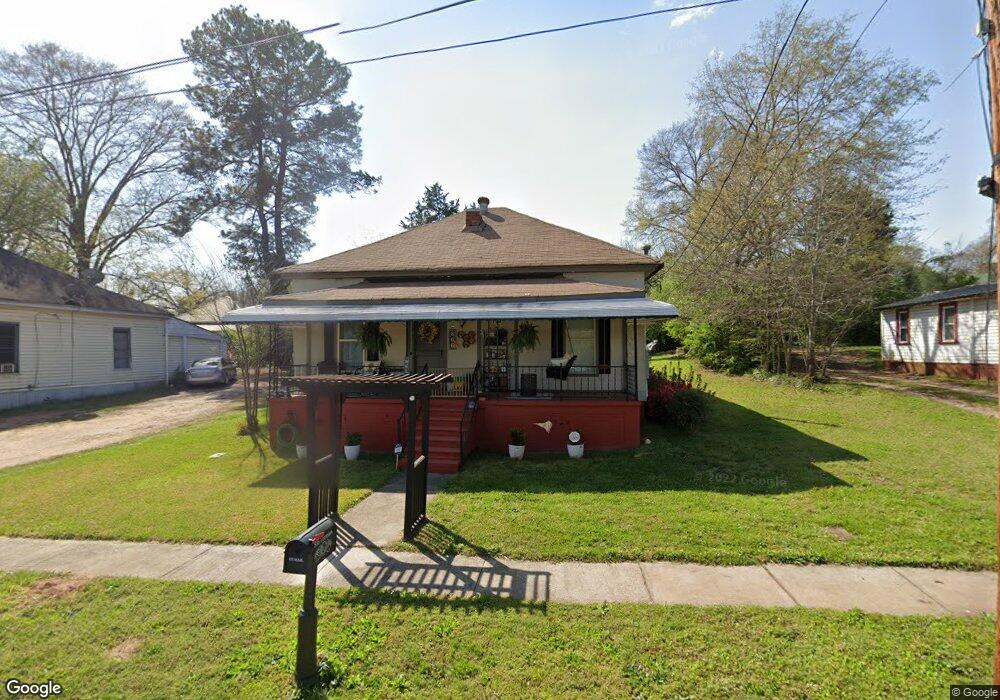
806 Leeman St Lagrange, GA 30240
Estimated Value: $85,000 - $128,000
2
Beds
2
Baths
1,216
Sq Ft
$91/Sq Ft
Est. Value
About This Home
This home is located at 806 Leeman St, Lagrange, GA 30240 and is currently estimated at $110,938, approximately $91 per square foot. 806 Leeman St is a home located in Troup County with nearby schools including Ethel W. Kight Elementary School, Hollis Hand Elementary School, and Franklin Forest Elementary School.
Ownership History
Date
Name
Owned For
Owner Type
Purchase Details
Closed on
Mar 11, 2020
Sold by
Khalousi Yousef
Bought by
Wagenaar Robert J and Wagenaar Rhonda L
Current Estimated Value
Home Financials for this Owner
Home Financials are based on the most recent Mortgage that was taken out on this home.
Original Mortgage
$51,300
Outstanding Balance
$23,116
Interest Rate
3.4%
Mortgage Type
New Conventional
Estimated Equity
$87,822
Purchase Details
Closed on
Mar 7, 2001
Sold by
Secretary Of Hud
Bought by
Khalousi Yousef
Purchase Details
Closed on
Jun 7, 2000
Sold by
Regions Mortgage Inc
Bought by
Secretary Of Hud
Purchase Details
Closed on
May 9, 2000
Sold by
Karen V Mccauley
Bought by
Regions Mortgage Inc
Purchase Details
Closed on
Feb 20, 1997
Sold by
Samuel D Bell
Bought by
Karen V Mccauley
Purchase Details
Closed on
Mar 11, 1960
Sold by
Bryant W C
Bought by
Samuel D Bell
Create a Home Valuation Report for This Property
The Home Valuation Report is an in-depth analysis detailing your home's value as well as a comparison with similar homes in the area
Purchase History
| Date | Buyer | Sale Price | Title Company |
|---|---|---|---|
| Wagenaar Robert J | $59,500 | -- | |
| Khalousi Yousef | $26,800 | -- | |
| Secretary Of Hud | $45,600 | -- | |
| Regions Mortgage Inc | $45,600 | -- | |
| Karen V Mccauley | $35,700 | -- | |
| Samuel D Bell | -- | -- |
Source: Public Records
Mortgage History
| Date | Status | Borrower | Loan Amount |
|---|---|---|---|
| Open | Wagenaar Robert J | $51,300 |
Source: Public Records
Tax History
| Year | Tax Paid | Tax Assessment Tax Assessment Total Assessment is a certain percentage of the fair market value that is determined by local assessors to be the total taxable value of land and additions on the property. | Land | Improvement |
|---|---|---|---|---|
| 2025 | $714 | $28,548 | $2,040 | $26,508 |
| 2024 | $714 | $26,188 | $2,040 | $24,148 |
| 2023 | $690 | $25,308 | $2,040 | $23,268 |
| 2022 | $665 | $23,828 | $2,040 | $21,788 |
| 2021 | $653 | $21,664 | $2,040 | $19,624 |
| 2020 | $532 | $17,624 | $2,040 | $15,584 |
| 2019 | $361 | $11,967 | $2,259 | $9,708 |
| 2018 | $344 | $11,407 | $2,259 | $9,148 |
| 2017 | $344 | $11,407 | $2,259 | $9,148 |
| 2016 | $331 | $10,988 | $2,259 | $8,729 |
| 2015 | $326 | $10,795 | $2,066 | $8,729 |
| 2014 | $313 | $10,336 | $2,066 | $8,270 |
| 2013 | -- | $11,106 | $2,056 | $9,050 |
Source: Public Records
Map
Nearby Homes
Your Personal Tour Guide
Ask me questions while you tour the home.