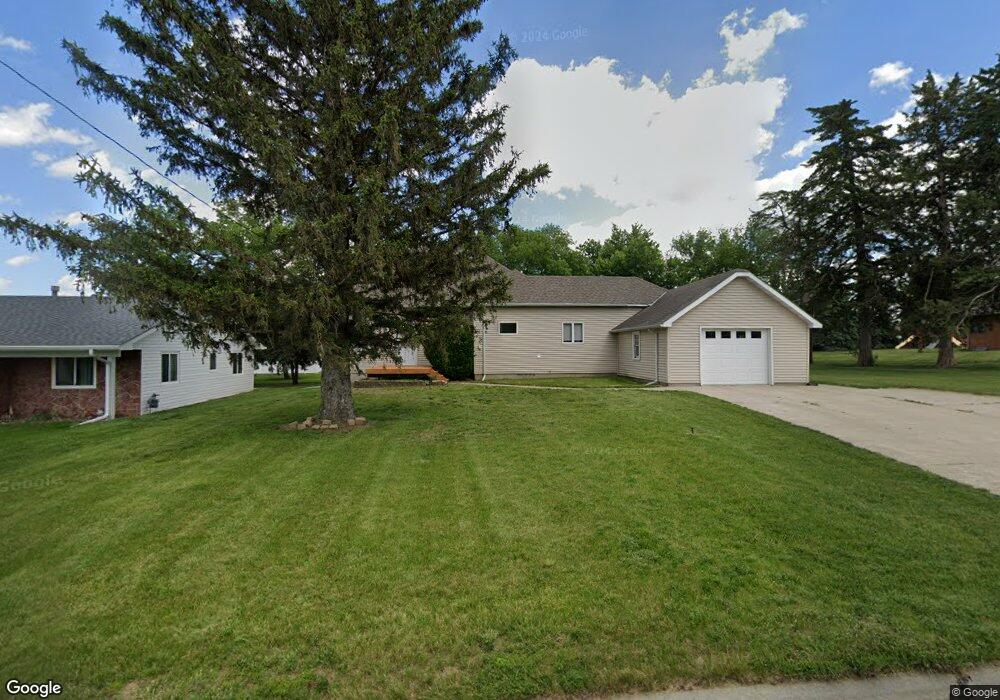
806 Main St Bancroft, NE 68004
Estimated Value: $150,814 - $169,000
2
Beds
2
Baths
1,462
Sq Ft
$111/Sq Ft
Est. Value
About This Home
This home is located at 806 Main St, Bancroft, NE 68004 and is currently estimated at $161,954, approximately $110 per square foot. 806 Main St is a home with nearby schools including Bancroft-Rosalie Elementary School.
Ownership History
Date
Name
Owned For
Owner Type
Purchase Details
Closed on
Nov 1, 2016
Sold by
Vankirk Anne E and Renz Anne E
Bought by
Vankirk Bryan J
Current Estimated Value
Home Financials for this Owner
Home Financials are based on the most recent Mortgage that was taken out on this home.
Original Mortgage
$72,000
Outstanding Balance
$57,913
Interest Rate
3.48%
Mortgage Type
New Conventional
Estimated Equity
$104,041
Purchase Details
Closed on
May 1, 2008
Sold by
Bonsell Christopher and Bonsell Candi
Bought by
Vankirk Bryan J and Vankirk Anne E
Home Financials for this Owner
Home Financials are based on the most recent Mortgage that was taken out on this home.
Original Mortgage
$54,000
Interest Rate
5.84%
Mortgage Type
New Conventional
Create a Home Valuation Report for This Property
The Home Valuation Report is an in-depth analysis detailing your home's value as well as a comparison with similar homes in the area
Home Values in the Area
Average Home Value in this Area
Purchase History
| Date | Buyer | Sale Price | Title Company |
|---|---|---|---|
| Vankirk Bryan J | -- | Stewart Title Company | |
| Vankirk Bryan J | $68,000 | -- |
Source: Public Records
Mortgage History
| Date | Status | Borrower | Loan Amount |
|---|---|---|---|
| Open | Vankirk Bryan J | $72,000 | |
| Closed | Vankirk Bryan J | $54,000 |
Source: Public Records
Tax History Compared to Growth
Tax History
| Year | Tax Paid | Tax Assessment Tax Assessment Total Assessment is a certain percentage of the fair market value that is determined by local assessors to be the total taxable value of land and additions on the property. | Land | Improvement |
|---|---|---|---|---|
| 2024 | $1,205 | $119,405 | $13,230 | $106,175 |
| 2023 | $1,060 | $81,555 | $11,760 | $69,795 |
| 2022 | $1,097 | $76,960 | $10,290 | $66,670 |
| 2021 | $1,187 | $83,230 | $4,410 | $78,820 |
| 2020 | $1,215 | $83,230 | $4,410 | $78,820 |
| 2019 | $1,320 | $90,775 | $4,410 | $86,365 |
| 2018 | $1,093 | $75,775 | $4,410 | $71,365 |
| 2017 | $1,042 | $75,770 | $4,410 | $71,360 |
| 2016 | $1,002 | $75,770 | $4,410 | $71,360 |
| 2015 | $993 | $75,770 | $4,410 | $71,360 |
| 2014 | $1,384 | $70,485 | $4,410 | $66,075 |
| 2013 | $1,384 | $70,485 | $4,410 | $66,075 |
Source: Public Records
Map
Nearby Homes