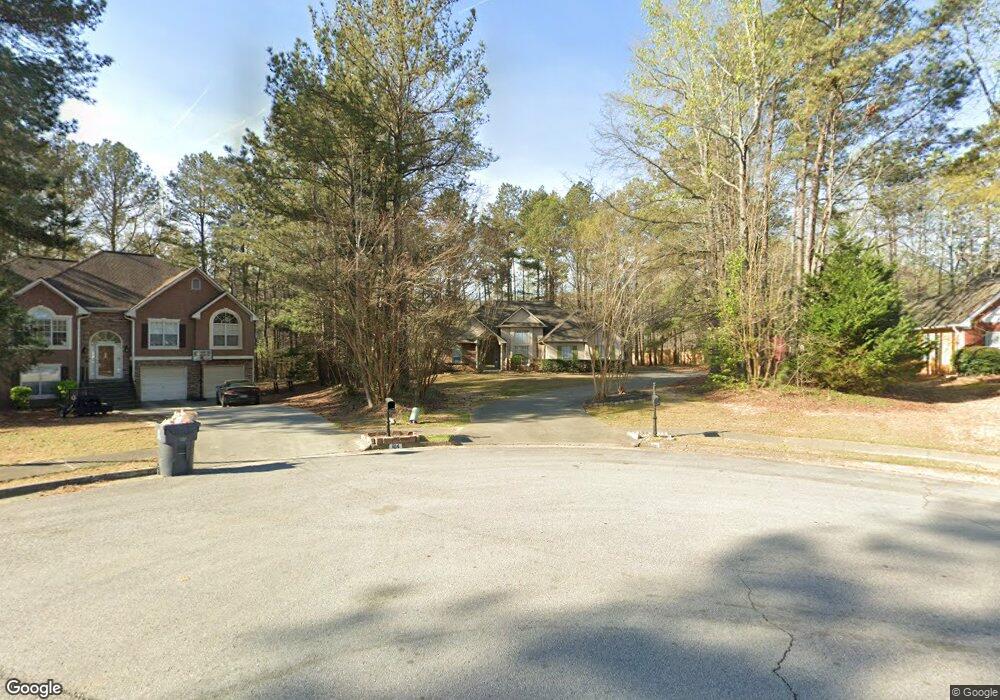
806 Millstead Ct Jonesboro, GA 30236
Estimated Value: $274,961 - $306,000
3
Beds
2
Baths
1,690
Sq Ft
$175/Sq Ft
Est. Value
About This Home
This home is located at 806 Millstead Ct, Jonesboro, GA 30236 and is currently estimated at $296,490, approximately $175 per square foot. 806 Millstead Ct is a home located in Henry County with nearby schools including Red Oak Elementary School, Dutchtown Middle School, and Dutchtown High School.
Ownership History
Date
Name
Owned For
Owner Type
Purchase Details
Closed on
May 4, 2010
Sold by
Young Bobby L
Bought by
Young Charline C and Barrett Charmaine
Current Estimated Value
Purchase Details
Closed on
Dec 28, 2009
Sold by
Young Bobby L
Bought by
Young Bobby and Young Charmaine
Home Financials for this Owner
Home Financials are based on the most recent Mortgage that was taken out on this home.
Original Mortgage
$108,007
Interest Rate
5.25%
Mortgage Type
FHA
Purchase Details
Closed on
Aug 4, 2009
Sold by
Mikell Mary D
Bought by
Us Bank Na Armt 2004-2
Purchase Details
Closed on
Sep 13, 2002
Sold by
Holmes Victoria M
Bought by
Mikell Mary D
Home Financials for this Owner
Home Financials are based on the most recent Mortgage that was taken out on this home.
Original Mortgage
$143,900
Interest Rate
6.3%
Mortgage Type
New Conventional
Purchase Details
Closed on
Nov 5, 1996
Sold by
Mcmillan Mcdonald Bldrs
Bought by
Holmes Victoria
Create a Home Valuation Report for This Property
The Home Valuation Report is an in-depth analysis detailing your home's value as well as a comparison with similar homes in the area
Home Values in the Area
Average Home Value in this Area
Purchase History
| Date | Buyer | Sale Price | Title Company |
|---|---|---|---|
| Young Charline C | -- | -- | |
| Young Bobby | -- | -- | |
| Young Bobby L | $110,000 | -- | |
| Us Bank Na Armt 2004-2 | $139,012 | -- | |
| Mikell Mary D | $159,900 | -- | |
| Holmes Victoria | $127,600 | -- |
Source: Public Records
Mortgage History
| Date | Status | Borrower | Loan Amount |
|---|---|---|---|
| Previous Owner | Young Bobby L | $108,007 | |
| Previous Owner | Mikell Mary D | $143,900 |
Source: Public Records
Tax History Compared to Growth
Tax History
| Year | Tax Paid | Tax Assessment Tax Assessment Total Assessment is a certain percentage of the fair market value that is determined by local assessors to be the total taxable value of land and additions on the property. | Land | Improvement |
|---|---|---|---|---|
| 2025 | $4,672 | $111,800 | $16,000 | $95,800 |
| 2024 | $4,672 | $114,000 | $16,000 | $98,000 |
| 2023 | $5,103 | $119,320 | $14,000 | $105,320 |
| 2022 | $3,526 | $90,000 | $14,000 | $76,000 |
| 2021 | $2,823 | $71,680 | $14,000 | $57,680 |
| 2020 | $2,530 | $64,040 | $10,000 | $54,040 |
| 2019 | $2,466 | $62,360 | $10,000 | $52,360 |
| 2018 | $2,342 | $59,120 | $10,000 | $49,120 |
| 2016 | $2,045 | $51,400 | $10,000 | $41,400 |
| 2015 | $1,792 | $43,440 | $8,000 | $35,440 |
| 2014 | $1,513 | $35,960 | $6,000 | $29,960 |
Source: Public Records
Map
Nearby Homes
- 617 Creekstone Ct
- 1009 Chads Ridge
- 182 Spivey Glen Dr
- 224 Reeves Creek Way
- 3139 Players Dr
- 1137 Baileys Ct
- 247 Spivey Ridge Cir
- 733 Berkeley Dr
- 732 Berkeley Dr
- 717 Berkeley Dr
- 706 Berkeley Dr
- 708 Berkeley Dr
- 725 Berkeley Dr
- 710 Berkeley Dr
- 745 Berkeley Dr
- 722 Berkeley Dr
- 718 Berkeley Dr
- 719 Berkeley Dr
- 712 Berkeley Dr
- 734 Berkeley Dr
- 814 Millstead Ct
- 419 Emerald Trace Unit IV
- 415 Emerald Trace
- 411 Emerald Trace
- 815 Millstead Ct Unit 4
- 427 Emerald Trace
- 807 Millstead Ct
- 407 Emerald Trace
- 410 Emerald Trace
- 416 Emerald Trace
- 433 Emerald Trace
- 420 Emerald Trace
- 932 Windmill Ct
- 940 Windmill Ct
- 403 Emerald Trace
- 424 Emerald Trace
- 404 Emerald Trace
- 926 Windmill Ct
- 428 Emerald Trace
- 0 Emerald Trace Unit 3167383