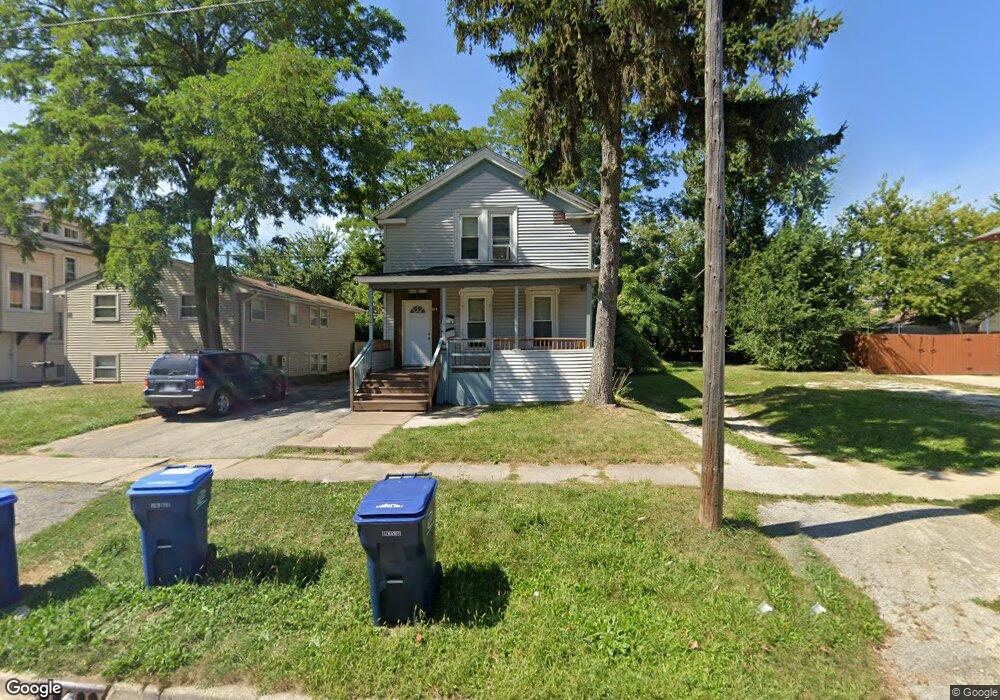
806 N Jackson St Waukegan, IL 60085
Estimated Value: $208,000 - $330,000
5
Beds
2
Baths
1,848
Sq Ft
$132/Sq Ft
Est. Value
About This Home
This home is located at 806 N Jackson St, Waukegan, IL 60085 and is currently estimated at $243,789, approximately $131 per square foot. 806 N Jackson St is a home located in Lake County with nearby schools including Glen Flora Elementary School, Edith M Smith Middle School, and Waukegan High School.
Ownership History
Date
Name
Owned For
Owner Type
Purchase Details
Closed on
Mar 3, 2017
Sold by
Secretary Of Housing & Urban Development
Bought by
Osorio Francisco
Current Estimated Value
Purchase Details
Closed on
Apr 5, 2013
Sold by
Pace Christopher
Bought by
Secretary Of Housing & Urban Development
Purchase Details
Closed on
Jul 5, 2007
Sold by
Grp Loan Llc
Bought by
Pace Christopher
Home Financials for this Owner
Home Financials are based on the most recent Mortgage that was taken out on this home.
Original Mortgage
$134,639
Interest Rate
6.76%
Mortgage Type
FHA
Purchase Details
Closed on
Sep 20, 2006
Sold by
Kennedy
Bought by
Grp Loan Llc
Purchase Details
Closed on
May 27, 2005
Sold by
Davis Charles and Davis Tamara
Bought by
Kennedy Nicole
Home Financials for this Owner
Home Financials are based on the most recent Mortgage that was taken out on this home.
Original Mortgage
$148,000
Interest Rate
7.85%
Mortgage Type
Commercial
Purchase Details
Closed on
Oct 3, 2003
Sold by
Arizmendi Pedro and Dominguez Silvia
Bought by
Davis Charles and Davis Tamara
Home Financials for this Owner
Home Financials are based on the most recent Mortgage that was taken out on this home.
Original Mortgage
$154,686
Interest Rate
6.23%
Mortgage Type
FHA
Purchase Details
Closed on
Jul 30, 2001
Sold by
Trujillo Mireya
Bought by
Dominguez Silvia and Arismendi Pedro
Home Financials for this Owner
Home Financials are based on the most recent Mortgage that was taken out on this home.
Original Mortgage
$117,000
Interest Rate
7.15%
Mortgage Type
Commercial
Purchase Details
Closed on
Nov 14, 2000
Sold by
Hud
Bought by
Trujillo Mireya
Purchase Details
Closed on
Jul 26, 2000
Sold by
Buhrke
Bought by
Hud
Purchase Details
Closed on
Apr 24, 1996
Sold by
Fenton Martin R
Bought by
Buhrke Kent R
Home Financials for this Owner
Home Financials are based on the most recent Mortgage that was taken out on this home.
Original Mortgage
$129,934
Interest Rate
7.91%
Mortgage Type
FHA
Purchase Details
Closed on
May 18, 1995
Sold by
Jones Allen A and Jones Marjory M
Bought by
Fenton Martin R
Home Financials for this Owner
Home Financials are based on the most recent Mortgage that was taken out on this home.
Original Mortgage
$118,500
Interest Rate
8.4%
Mortgage Type
FHA
Create a Home Valuation Report for This Property
The Home Valuation Report is an in-depth analysis detailing your home's value as well as a comparison with similar homes in the area
Home Values in the Area
Average Home Value in this Area
Purchase History
| Date | Buyer | Sale Price | Title Company |
|---|---|---|---|
| Osorio Francisco | -- | First American Title | |
| Secretary Of Housing & Urban Development | -- | None Available | |
| Pace Christopher | $137,000 | First American Title | |
| Grp Loan Llc | -- | None Available | |
| Kennedy Nicole | $185,000 | First American Title | |
| Davis Charles | $157,000 | -- | |
| Dominguez Silvia | $130,000 | -- | |
| Trujillo Mireya | -- | Stewart Title Company | |
| Hud | -- | -- | |
| Buhrke Kent R | $130,000 | Chicago Title Insurance Co | |
| Fenton Martin R | $55,000 | Chicago Title Insurance Co |
Source: Public Records
Mortgage History
| Date | Status | Borrower | Loan Amount |
|---|---|---|---|
| Previous Owner | Pace Christopher | $134,639 | |
| Previous Owner | Kennedy Nicole | $148,000 | |
| Previous Owner | Davis Charles | $154,686 | |
| Previous Owner | Dominguez Silvia | $117,000 | |
| Previous Owner | Buhrke Kent R | $129,934 | |
| Previous Owner | Fenton Martin R | $118,500 |
Source: Public Records
Tax History Compared to Growth
Tax History
| Year | Tax Paid | Tax Assessment Tax Assessment Total Assessment is a certain percentage of the fair market value that is determined by local assessors to be the total taxable value of land and additions on the property. | Land | Improvement |
|---|---|---|---|---|
| 2024 | $4,462 | $52,518 | $6,376 | $46,142 |
| 2023 | $4,546 | $47,321 | $5,708 | $41,613 |
| 2022 | $4,546 | $46,502 | $5,158 | $41,344 |
| 2021 | $4,177 | $40,069 | $4,601 | $35,468 |
| 2020 | $3,824 | $33,734 | $4,286 | $29,448 |
| 2019 | $3,848 | $30,911 | $3,927 | $26,984 |
| 2018 | $2,026 | $15,672 | $5,003 | $10,669 |
| 2017 | $1,972 | $13,865 | $4,426 | $9,439 |
| 2016 | $3,949 | $25,554 | $3,846 | $21,708 |
| 2015 | $2,850 | $22,871 | $3,442 | $19,429 |
| 2014 | $2,870 | $22,954 | $4,191 | $18,763 |
| 2012 | $3,872 | $24,869 | $4,541 | $20,328 |
Source: Public Records
Map
Nearby Homes
- 917 N Linden Ave
- 620 N Poplar St
- 702 Franklin St
- 918 N Ash St
- 522 N Poplar St
- 824 N Butrick St
- 1000 Pine St
- 511 Chestnut St
- 428 N Poplar St
- 1105 Woodlawn Cir
- 509 N Butrick St
- 1110 N Ash St
- 1122 N Ash St
- 452 North Ave
- 415 W Ridgeland Ave
- 968 Judge Ave
- 325 4th St
- 1117 Judge Ave
- 1335 Chestnut St
- 1504 W Glen Flora Ave
- 810 N Jackson St
- 800 N Jackson St
- 726 N Jackson St
- 812 N Jackson St
- 722 N Jackson St
- 814 N Jackson St
- 747 Walnut St Unit 2E
- 747 Walnut St
- 747 Walnut St Unit 1E
- 747 Walnut St Unit 2W
- 741 Walnut St Unit 741
- 743 Walnut St Unit 2C
- 743 Walnut St Unit 1A
- 737 Walnut St Unit 737
- 759 Walnut St
- 739 Walnut St Unit 2D
- 739 Walnut St Unit 1B
- 739 Walnut St Unit 739
- 739 Walnut St
- 801 N Jackson St