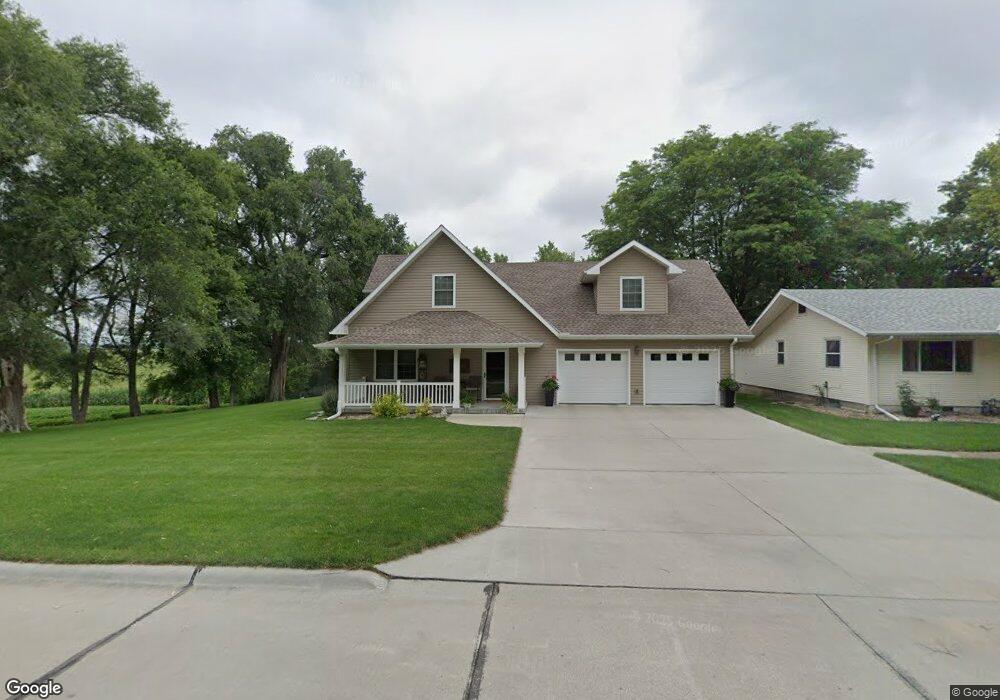
806 Pine St Humphrey, NE 68642
Estimated Value: $317,724 - $402,000
--
Bed
2
Baths
2,192
Sq Ft
$164/Sq Ft
Est. Value
About This Home
This home is located at 806 Pine St, Humphrey, NE 68642 and is currently estimated at $359,681, approximately $164 per square foot. 806 Pine St is a home located in Platte County with nearby schools including Humphrey Elementary School, Lindsay Attendance Center, and Humphrey Junior/Senior High School.
Ownership History
Date
Name
Owned For
Owner Type
Purchase Details
Closed on
Jan 2, 2018
Sold by
Krings Steven D and Krings Ashley M
Bought by
Olmer James D and Olmer Beverly A
Current Estimated Value
Purchase Details
Closed on
Sep 22, 2009
Sold by
Cbs Partners
Bought by
Krings Steven D and Krings Ashley
Purchase Details
Closed on
Jul 30, 2009
Sold by
Secretary Of Housing & Urban Develop
Bought by
Krings Steven D and Krings Ashley M
Purchase Details
Closed on
Jun 6, 2008
Sold by
Gary Mccubbin Wells
Bought by
Seccretary Of Housing & Urban Developmen
Create a Home Valuation Report for This Property
The Home Valuation Report is an in-depth analysis detailing your home's value as well as a comparison with similar homes in the area
Home Values in the Area
Average Home Value in this Area
Purchase History
| Date | Buyer | Sale Price | Title Company |
|---|---|---|---|
| Olmer James D | $296,889 | None Available | |
| Krings Steven D | -- | -- | |
| Krings Steven D | $50,000 | -- | |
| Seccretary Of Housing & Urban Developmen | $95,800 | -- | |
| Wells Fargo Bank Na | $95,800 | -- |
Source: Public Records
Tax History Compared to Growth
Tax History
| Year | Tax Paid | Tax Assessment Tax Assessment Total Assessment is a certain percentage of the fair market value that is determined by local assessors to be the total taxable value of land and additions on the property. | Land | Improvement |
|---|---|---|---|---|
| 2024 | $2,592 | $285,590 | $18,165 | $267,425 |
| 2023 | $3,296 | $281,365 | $13,940 | $267,425 |
| 2022 | $3,264 | $263,205 | $13,940 | $249,265 |
| 2021 | $3,413 | $262,430 | $13,940 | $248,490 |
| 2020 | $3,417 | $262,430 | $13,940 | $248,490 |
| 2019 | $2,902 | $224,385 | $11,325 | $213,060 |
| 2018 | $2,827 | $224,385 | $11,325 | $213,060 |
| 2017 | $1,676 | $134,315 | $11,325 | $122,990 |
| 2016 | $1,608 | $134,315 | $11,325 | $122,990 |
| 2015 | $1,623 | $134,315 | $11,325 | $122,990 |
| 2014 | $1,657 | $126,270 | $11,325 | $114,945 |
| 2012 | -- | $111,260 | $7,920 | $103,340 |
Source: Public Records
Map
Nearby Homes