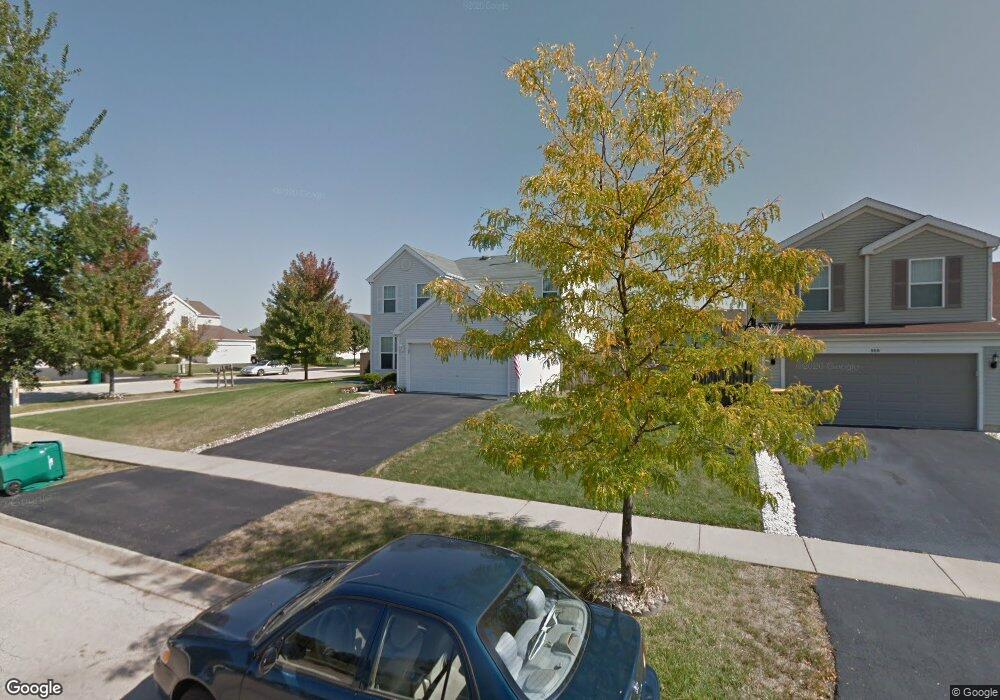
806 Prairie Path Ln Unit 3 Joliet, IL 60436
Southwest Joliet NeighborhoodEstimated Value: $351,000 - $366,000
3
Beds
3
Baths
1,752
Sq Ft
$204/Sq Ft
Est. Value
About This Home
This home is located at 806 Prairie Path Ln Unit 3, Joliet, IL 60436 and is currently estimated at $357,949, approximately $204 per square foot. 806 Prairie Path Ln Unit 3 is a home located in Will County with nearby schools including Heritage Trail Elementary School, Troy Middle School, and Orenic Intermediate School.
Ownership History
Date
Name
Owned For
Owner Type
Purchase Details
Closed on
Aug 16, 2017
Sold by
Silha Christopher J and Silha Abigail A
Bought by
Hopkins D Monte J
Current Estimated Value
Purchase Details
Closed on
Jun 27, 2002
Sold by
Springwood Llc
Bought by
Silha Christopher J and Silha Abigail A
Home Financials for this Owner
Home Financials are based on the most recent Mortgage that was taken out on this home.
Original Mortgage
$159,355
Interest Rate
6.91%
Mortgage Type
FHA
Create a Home Valuation Report for This Property
The Home Valuation Report is an in-depth analysis detailing your home's value as well as a comparison with similar homes in the area
Home Values in the Area
Average Home Value in this Area
Purchase History
| Date | Buyer | Sale Price | Title Company |
|---|---|---|---|
| Hopkins D Monte J | $210,000 | Fidelity National Title Ins | |
| Silha Christopher J | $162,000 | -- |
Source: Public Records
Mortgage History
| Date | Status | Borrower | Loan Amount |
|---|---|---|---|
| Previous Owner | Silha Christopher J | $159,355 |
Source: Public Records
Tax History Compared to Growth
Tax History
| Year | Tax Paid | Tax Assessment Tax Assessment Total Assessment is a certain percentage of the fair market value that is determined by local assessors to be the total taxable value of land and additions on the property. | Land | Improvement |
|---|---|---|---|---|
| 2024 | $8,502 | $104,840 | $16,619 | $88,221 |
| 2023 | $8,502 | $94,196 | $14,932 | $79,264 |
| 2022 | $6,928 | $80,647 | $14,129 | $66,518 |
| 2021 | $6,492 | $75,868 | $13,292 | $62,576 |
| 2020 | $6,280 | $73,496 | $13,292 | $60,204 |
| 2019 | $6,089 | $70,500 | $12,750 | $57,750 |
| 2018 | $5,700 | $64,600 | $12,750 | $51,850 |
| 2017 | $5,266 | $59,100 | $12,750 | $46,350 |
| 2016 | $5,101 | $55,600 | $12,750 | $42,850 |
| 2015 | $4,733 | $52,448 | $11,448 | $41,000 |
| 2014 | $4,733 | $50,498 | $11,448 | $39,050 |
| 2013 | $4,733 | $53,011 | $11,448 | $41,563 |
Source: Public Records
Map
Nearby Homes
- 2903 Clearview Ct
- 2812 Clearview Dr
- 3219 Quincy Ct
- 644 Spring Leaf Dr
- 3104 Meadowsedge Ln
- 594 Spring Leaf Dr
- 597 Spring Leaf Dr
- 985 Leawood Dr
- 3223 Karen Ct
- 3266 Cathy Dr
- 710 Silver Leaf Ct Unit 1
- 615 Silver Leaf Dr
- 743 Springwood Dr
- 197 Barbara Jean Ln Unit 4
- 2632 Crescenzo Dr
- 2626 Crescenzo Dr Unit F
- 2542 Par Four Ct Unit 12B
- 180 Barbara Jean Ln Unit D
- 181 Saenz Ln Unit A22
- 2308 Madonna Ave
- 808 Prairie Path Ln Unit 3
- 810 Prairie Path Ln
- 805 Thorn Creek Dr
- 807 Thorn Creek Dr
- 3008 Bloomfield Dr Unit 3
- 812 Prairie Path Ln Unit 3
- 3003 Bloomfield Dr
- 3001 Bloomfield Dr Unit 3
- 809 Thorn Creek Dr
- 3005 Bloomfield Dr Unit 3
- 2921 Bloomfield Dr Unit 1
- 3005 Arborsedge Dr Unit 3
- 3010 Bloomfield Dr Unit 3
- 3007 Bloomfield Dr
- 2919 Bloomfield Dr
- 814 Prairie Path Ln Unit 3
- 811 Thorn Creek Dr
- 3007 Arborsedge Dr
- 3012 Bloomfield Dr Unit 3
- 2917 Bloomfield Dr