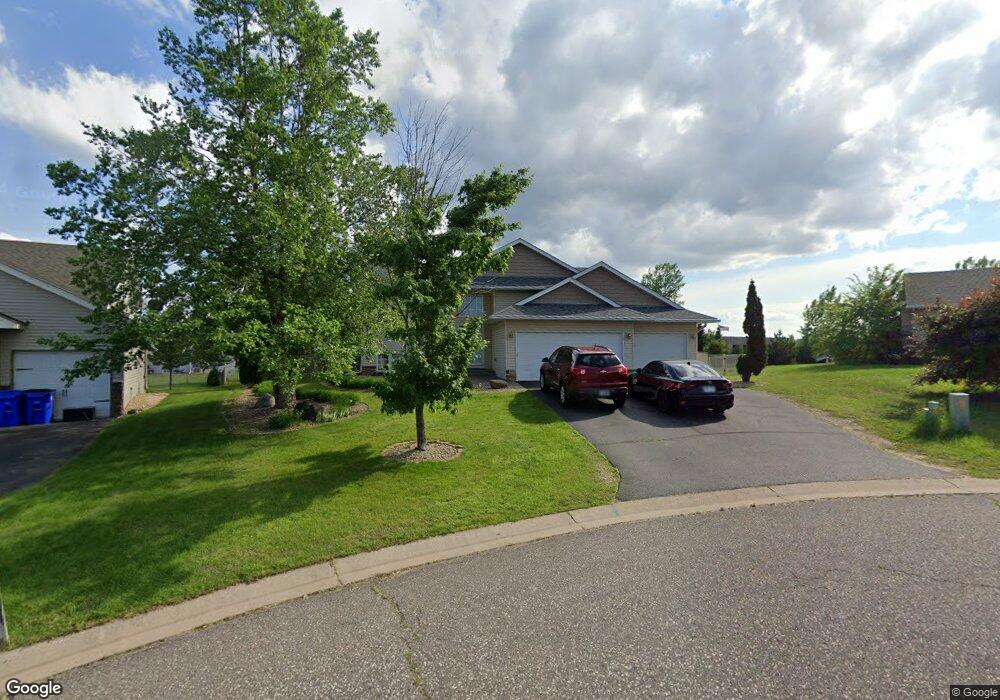
806 Rose Ct Somerset, WI 54025
Estimated Value: $363,657 - $394,000
5
Beds
3
Baths
1,196
Sq Ft
$315/Sq Ft
Est. Value
About This Home
This home is located at 806 Rose Ct, Somerset, WI 54025 and is currently estimated at $376,664, approximately $314 per square foot. 806 Rose Ct is a home located in St. Croix County with nearby schools including Somerset Elementary School, Somerset Middle School, and Somerset High School.
Ownership History
Date
Name
Owned For
Owner Type
Purchase Details
Closed on
Dec 7, 2011
Sold by
Anderson Michael P and Anderson Mindy M
Bought by
Bute Van T
Current Estimated Value
Home Financials for this Owner
Home Financials are based on the most recent Mortgage that was taken out on this home.
Original Mortgage
$138,000
Outstanding Balance
$94,853
Interest Rate
4.11%
Mortgage Type
VA
Estimated Equity
$281,811
Purchase Details
Closed on
Jan 19, 2007
Sold by
Preferred Builders Inc
Bought by
Anderson Michael P and Anderson Mindy M
Home Financials for this Owner
Home Financials are based on the most recent Mortgage that was taken out on this home.
Original Mortgage
$205,308
Interest Rate
6.19%
Mortgage Type
New Conventional
Create a Home Valuation Report for This Property
The Home Valuation Report is an in-depth analysis detailing your home's value as well as a comparison with similar homes in the area
Home Values in the Area
Average Home Value in this Area
Purchase History
| Date | Buyer | Sale Price | Title Company |
|---|---|---|---|
| Bute Van T | $138,000 | None Available | |
| Anderson Michael P | $256,700 | None Available | |
| Preferred Builders Inc | $15,000 | Land Title Inc |
Source: Public Records
Mortgage History
| Date | Status | Borrower | Loan Amount |
|---|---|---|---|
| Open | Bute Van T | $138,000 | |
| Previous Owner | Preferred Builders Inc | $205,308 | |
| Previous Owner | Anderson Michael P | $51,327 |
Source: Public Records
Tax History Compared to Growth
Tax History
| Year | Tax Paid | Tax Assessment Tax Assessment Total Assessment is a certain percentage of the fair market value that is determined by local assessors to be the total taxable value of land and additions on the property. | Land | Improvement |
|---|---|---|---|---|
| 2024 | $46 | $259,000 | $40,500 | $218,500 |
| 2023 | $4,313 | $259,000 | $40,500 | $218,500 |
| 2022 | $4,208 | $259,000 | $40,500 | $218,500 |
| 2021 | $4,241 | $259,000 | $40,500 | $218,500 |
| 2020 | $3,728 | $259,000 | $40,500 | $218,500 |
| 2019 | $3,936 | $157,200 | $23,500 | $133,700 |
| 2018 | $3,685 | $157,200 | $23,500 | $133,700 |
| 2017 | $3,611 | $157,200 | $23,500 | $133,700 |
| 2016 | $3,611 | $157,200 | $23,500 | $133,700 |
| 2015 | $3,689 | $157,200 | $23,500 | $133,700 |
| 2014 | $3,624 | $157,200 | $23,500 | $133,700 |
| 2013 | $3,644 | $157,200 | $23,500 | $133,700 |
Source: Public Records
Map
Nearby Homes
- 231 Plum Tree Ln
- 309 Walnut Ln
- 310 Aspen Dr
- 318 Aspen Dr
- 325 Aspen Dr
- 1820 County Road C
- 873 Sutherland St
- 869 Sutherland St
- 861 Sutherland St
- 821 Sutherland St
- 829 Sutherland St
- 837 Sutherland St
- 1992 80th St
- 1888 80th St
- 325 Church Hill Rd
- The Rockport Plan at Pine Vale
- The Newport Plan at Pine Vale
- The Brook View Plan at Pine Vale
- The Cheyenne Plan at Pine Vale
- The Ashton Plan at Pine Vale