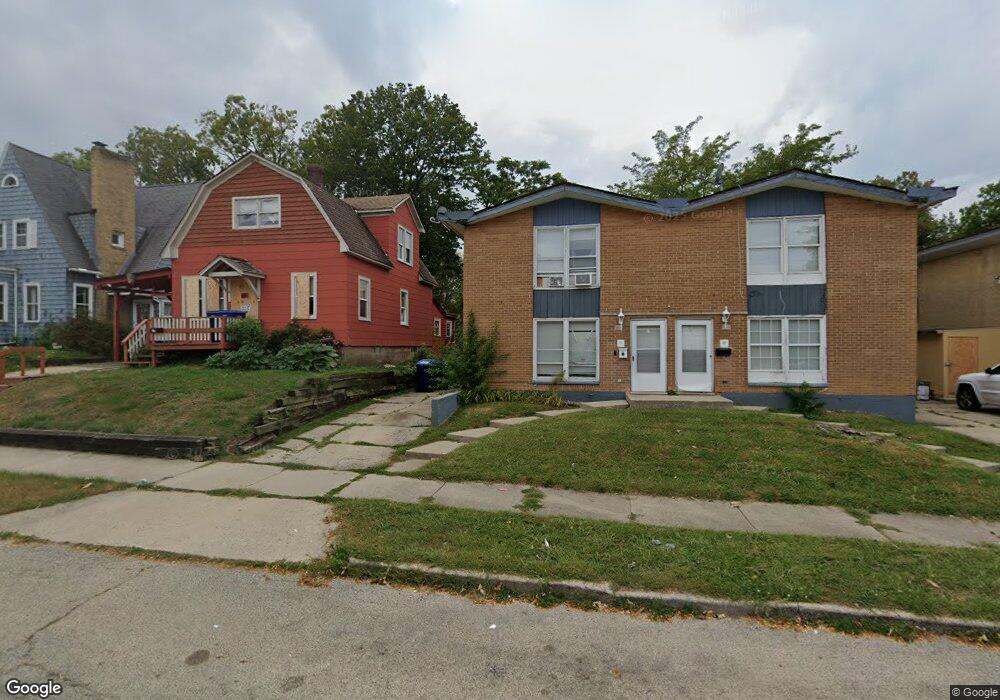
806 S Ml King jr Ave Waukegan, IL 60085
Estimated Value: $135,000 - $217,000
2
Beds
2
Baths
1,280
Sq Ft
$140/Sq Ft
Est. Value
About This Home
This home is located at 806 S Ml King jr Ave, Waukegan, IL 60085 and is currently estimated at $179,209, approximately $140 per square foot. 806 S Ml King jr Ave is a home located in Lake County with nearby schools including Carman-Buckner Elementary School, John R Lewis Middle School, and Waukegan High School.
Ownership History
Date
Name
Owned For
Owner Type
Purchase Details
Closed on
Feb 17, 2000
Sold by
Wilborn James A
Bought by
Mcneely William T and Mcneely Patricia A
Current Estimated Value
Home Financials for this Owner
Home Financials are based on the most recent Mortgage that was taken out on this home.
Original Mortgage
$72,930
Outstanding Balance
$25,848
Interest Rate
9.15%
Estimated Equity
$153,361
Purchase Details
Closed on
Jan 11, 2000
Sold by
Hillary John E and Hillary Wanda M
Bought by
Wilborn James A
Home Financials for this Owner
Home Financials are based on the most recent Mortgage that was taken out on this home.
Original Mortgage
$72,930
Outstanding Balance
$25,848
Interest Rate
9.15%
Estimated Equity
$153,361
Purchase Details
Closed on
Jan 7, 2000
Sold by
Hillary Robert J
Bought by
Wilborn James A
Home Financials for this Owner
Home Financials are based on the most recent Mortgage that was taken out on this home.
Original Mortgage
$72,930
Outstanding Balance
$25,848
Interest Rate
9.15%
Estimated Equity
$153,361
Purchase Details
Closed on
Sep 18, 1995
Sold by
Hillary Robert J
Bought by
Wilborn James A
Create a Home Valuation Report for This Property
The Home Valuation Report is an in-depth analysis detailing your home's value as well as a comparison with similar homes in the area
Home Values in the Area
Average Home Value in this Area
Purchase History
| Date | Buyer | Sale Price | Title Company |
|---|---|---|---|
| Mcneely William T | $90,000 | -- | |
| Wilborn James A | -- | -- | |
| Wilborn James A | -- | -- | |
| Wilborn James A | $33,500 | -- | |
| Wilborn James A | -- | -- |
Source: Public Records
Mortgage History
| Date | Status | Borrower | Loan Amount |
|---|---|---|---|
| Open | Mcneely William T | $72,930 |
Source: Public Records
Tax History Compared to Growth
Tax History
| Year | Tax Paid | Tax Assessment Tax Assessment Total Assessment is a certain percentage of the fair market value that is determined by local assessors to be the total taxable value of land and additions on the property. | Land | Improvement |
|---|---|---|---|---|
| 2024 | $3,639 | $43,101 | $2,846 | $40,255 |
| 2023 | $3,101 | $38,588 | $2,548 | $36,040 |
| 2022 | $3,101 | $31,718 | $1,982 | $29,736 |
| 2021 | $2,834 | $27,178 | $1,727 | $25,451 |
| 2020 | $2,634 | $23,239 | $1,611 | $21,628 |
| 2019 | $2,651 | $21,295 | $1,476 | $19,819 |
| 2018 | $1,796 | $13,890 | $1,207 | $12,683 |
| 2017 | $1,748 | $12,289 | $1,068 | $11,221 |
| 2016 | $2,357 | $15,255 | $1,325 | $13,930 |
| 2015 | $2,306 | $13,654 | $1,186 | $12,468 |
| 2014 | $2,780 | $16,434 | $1,593 | $14,841 |
| 2012 | $3,446 | $17,804 | $1,726 | $16,078 |
Source: Public Records
Map
Nearby Homes
- 710 S Martin Luther King Junior Ave
- 924 Lenox Ave
- 515 May St
- 842 Wadsworth Ave
- 631 8th St
- 815 Prescott St
- 724 10th St
- 600 Sunderlin St
- 547 S Martin Luther King Junior Ave
- 1102 Wadsworth Ave
- 1101 Adams St
- 1210 Park Ave
- 502 Belvidere Rd
- 720 13th St
- 408 Besley Place
- 305 Besley Place
- 613 Clarke Ave
- 446 S Jackson St
- 1244 Victoria Ave
- 215 S Park Ave
- 804 S Ml King jr Ave
- 814 S Martin Luther King Junior Ave
- 814 S Martin Luther King jr Ave
- 814 S Ml King jr Ave
- 802 S Ml King jr Ave
- 802 S Martin Luther King Junior Ave
- 307 8th St
- 816 S Ml King jr Ave
- 800 S Ml King jr Ave
- 309 8th St
- 820 S Martin Luther King jr Ave
- 820 S Ml King jr Ave
- 822 S Ml King jr Ave
- 803 S Ml King jr Ave
- 807 Lenox Ave
- 811 Lenox Ave
- 822 S Martin Luther King Junior Ave
- 826 S Ml King jr Ave
- 803 Lenox Ave
- 826 S Martin Luther King jr Ave