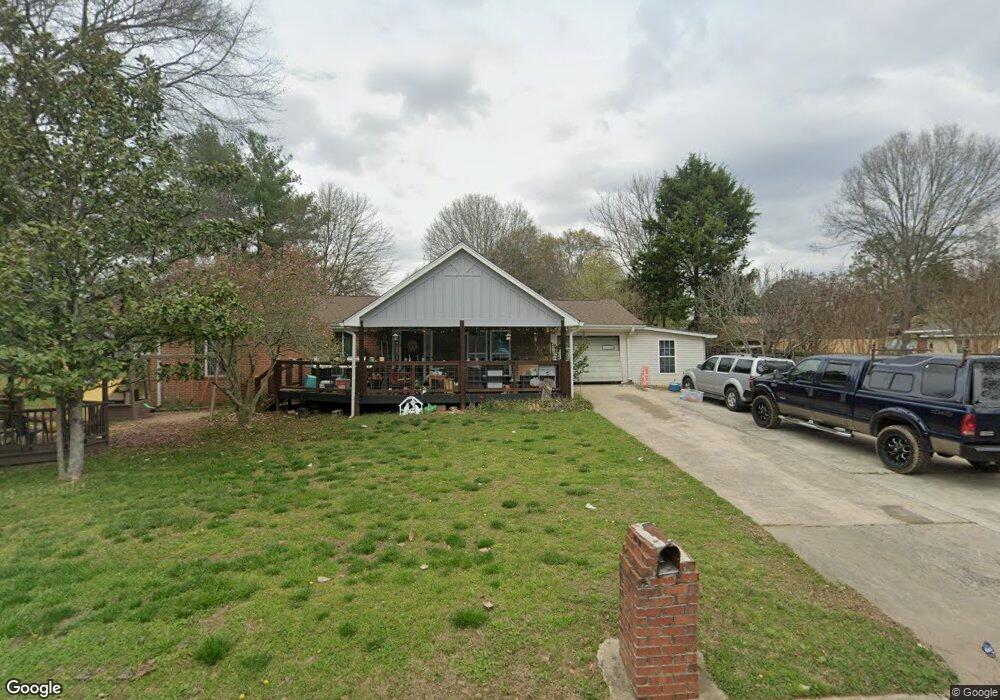
806 W Girard Ave Cedartown, GA 30125
Estimated Value: $212,000 - $231,000
4
Beds
3
Baths
1,691
Sq Ft
$131/Sq Ft
Est. Value
About This Home
This home is located at 806 W Girard Ave, Cedartown, GA 30125 and is currently estimated at $221,095, approximately $130 per square foot. 806 W Girard Ave is a home located in Polk County with nearby schools including Cedar Christian School and Vineyard Harvester Christian Academy.
Ownership History
Date
Name
Owned For
Owner Type
Purchase Details
Closed on
Mar 1, 2011
Sold by
Cruz Sipriano
Bought by
Cruz Sipriano
Current Estimated Value
Purchase Details
Closed on
Dec 2, 1999
Sold by
Shaw Betty Ann
Bought by
Cruz Sipriano
Purchase Details
Closed on
Jul 26, 1990
Sold by
Shaw Jerry Eugene
Bought by
Shaw Betty Ann
Purchase Details
Closed on
Apr 2, 1990
Sold by
Shaw Jerry Eugene
Bought by
Shaw Betty Ann
Purchase Details
Closed on
Jun 15, 1981
Bought by
Shaw Betty Ann
Purchase Details
Closed on
Sep 25, 1979
Sold by
Shaw Jerry E
Bought by
Shaw Betty Ann
Purchase Details
Closed on
Jun 28, 1974
Sold by
Lamil Development Co
Bought by
Shaw Jerry E
Purchase Details
Closed on
Dec 13, 1973
Sold by
C & S Bank
Bought by
Lamil Development Co
Purchase Details
Closed on
Jun 6, 1973
Sold by
Modern Maid Homes
Bought by
C & S Bank
Purchase Details
Closed on
Aug 13, 1970
Bought by
Modern Maid Homes
Create a Home Valuation Report for This Property
The Home Valuation Report is an in-depth analysis detailing your home's value as well as a comparison with similar homes in the area
Home Values in the Area
Average Home Value in this Area
Purchase History
| Date | Buyer | Sale Price | Title Company |
|---|---|---|---|
| Cruz Sipriano | $64,000 | -- | |
| Cruz Sipriano | $64,000 | -- | |
| Shaw Betty Ann | -- | -- | |
| Shaw Betty Ann | -- | -- | |
| Shaw Betty Ann | -- | -- | |
| Shaw Betty Ann | -- | -- | |
| Shaw Jerry E | -- | -- | |
| Lamil Development Co | -- | -- | |
| C & S Bank | -- | -- | |
| Modern Maid Homes | -- | -- |
Source: Public Records
Tax History Compared to Growth
Tax History
| Year | Tax Paid | Tax Assessment Tax Assessment Total Assessment is a certain percentage of the fair market value that is determined by local assessors to be the total taxable value of land and additions on the property. | Land | Improvement |
|---|---|---|---|---|
| 2024 | $2,622 | $84,327 | $5,320 | $79,007 |
| 2023 | $1,533 | $45,598 | $3,040 | $42,558 |
| 2022 | $905 | $40,145 | $3,040 | $37,105 |
| 2021 | $917 | $40,145 | $3,040 | $37,105 |
| 2020 | $919 | $40,145 | $3,040 | $37,105 |
| 2019 | $835 | $33,083 | $2,645 | $30,438 |
| 2018 | $821 | $31,813 | $2,645 | $29,168 |
| 2017 | $811 | $31,813 | $2,645 | $29,168 |
| 2016 | $811 | $31,813 | $2,645 | $29,168 |
| 2015 | $729 | $28,720 | $2,645 | $26,075 |
| 2014 | $735 | $28,720 | $2,645 | $26,075 |
Source: Public Records
Map
Nearby Homes
- 309 Walnut St
- 605 W Girard Ave
- 422 Walnut St
- 258 Chestnut St
- 443 N Cave Spring St
- 305 N Cave Spring St
- 421 Wissahickon Ave
- 214 Victoria Ave
- 382 5th St
- 293 4th St
- 607 N College St
- 408 N College St
- 214 Jule Peek Ave
- 228 Marshall St
- 144 Marshall St
- 328 Mountain Home Rd
- 601 Mountain Home Rd
- 119 Jackson St
- 403 Lakeside Dr
- 521 W John Hand Rd
- 810 W Girard Ave
- 108 McCarson Ct
- 811 W Girard Ave
- 504 Lynton Dr
- 505 Pine St
- 509 Pine St
- 803 W Girard Ave
- 0 Pine St Unit 10155042
- 0 Pine St Unit 10155035
- 0 Pine St Unit 10155028
- 0 Pine St Unit 10155025
- 815 W Girard Ave
- 513 Pine St
- 500 Lynton Dr
- 504 Pine St
- 510 Pine St
- 112 McCarson Ct
- 819 W Girard Ave
- 419 Pine St
- 0 W Girard Ave Unit 6892076