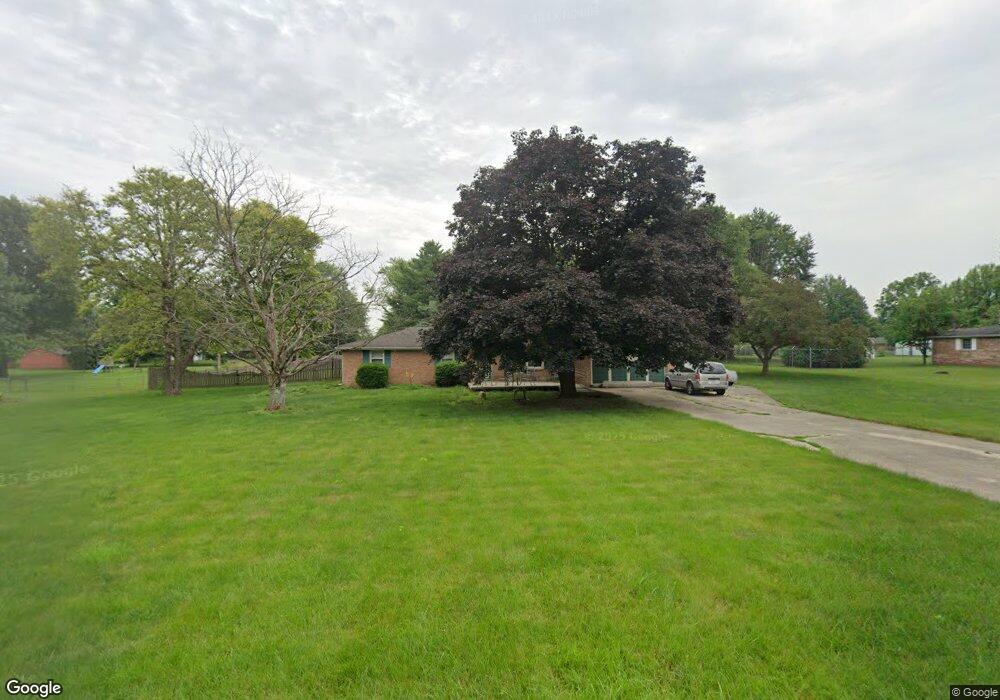
806 Whitmore St Anderson, IN 46012
Estimated Value: $227,189 - $250,000
3
Beds
2
Baths
1,700
Sq Ft
$139/Sq Ft
Est. Value
About This Home
This home is located at 806 Whitmore St, Anderson, IN 46012 and is currently estimated at $235,547, approximately $138 per square foot. 806 Whitmore St is a home located in Madison County with nearby schools including Eastside Elementary School, Highland Middle School, and Anderson High School.
Ownership History
Date
Name
Owned For
Owner Type
Purchase Details
Closed on
Oct 23, 2014
Sold by
Sandlin Laura
Bought by
Renfro Jeffrey
Current Estimated Value
Purchase Details
Closed on
May 25, 2010
Sold by
Renfro Jeffrey C
Bought by
Sandlin Laura
Purchase Details
Closed on
May 31, 2006
Sold by
Livesay Mitchell and Livesay Sally M
Bought by
Renfro Jeffery
Home Financials for this Owner
Home Financials are based on the most recent Mortgage that was taken out on this home.
Original Mortgage
$114,000
Interest Rate
6.5%
Mortgage Type
Adjustable Rate Mortgage/ARM
Purchase Details
Closed on
Sep 12, 2005
Sold by
Beck Bruce W and Beck Cynthia L
Bought by
Livesay Mitchell and Livesay Sally M
Create a Home Valuation Report for This Property
The Home Valuation Report is an in-depth analysis detailing your home's value as well as a comparison with similar homes in the area
Home Values in the Area
Average Home Value in this Area
Purchase History
| Date | Buyer | Sale Price | Title Company |
|---|---|---|---|
| Renfro Jeffrey | -- | -- | |
| Sandlin Laura | -- | -- | |
| Renfro Jeffery | -- | -- | |
| Livesay Mitchell | -- | -- |
Source: Public Records
Mortgage History
| Date | Status | Borrower | Loan Amount |
|---|---|---|---|
| Previous Owner | Renfro Jeffery | $114,000 |
Source: Public Records
Tax History Compared to Growth
Tax History
| Year | Tax Paid | Tax Assessment Tax Assessment Total Assessment is a certain percentage of the fair market value that is determined by local assessors to be the total taxable value of land and additions on the property. | Land | Improvement |
|---|---|---|---|---|
| 2025 | $1,134 | $109,500 | $17,300 | $92,200 |
| 2024 | $1,134 | $109,500 | $17,300 | $92,200 |
| 2023 | $1,110 | $98,100 | $16,600 | $81,500 |
| 2022 | $1,149 | $97,800 | $16,300 | $81,500 |
| 2021 | $1,059 | $91,100 | $16,300 | $74,800 |
| 2020 | $884 | $92,100 | $15,600 | $76,500 |
| 2019 | $911 | $91,800 | $15,600 | $76,200 |
| 2018 | $829 | $85,000 | $15,600 | $69,400 |
| 2017 | $843 | $90,500 | $15,600 | $74,900 |
| 2016 | $893 | $90,700 | $15,600 | $75,100 |
| 2014 | $801 | $90,700 | $15,600 | $75,100 |
| 2013 | $801 | $90,800 | $15,600 | $75,200 |
Source: Public Records
Map
Nearby Homes
- 3730 County Road 150 N
- 405 North St
- 407 Crestview Ct
- 4429 Village Dr
- 724 W Main St
- 4644 County Road 150 N
- 531 W Plum St
- 321 S Washington St
- 66 Circle Dr
- 4765 E 200 N
- 2101 N 300 E
- 3776 Cameron Ct
- 300 South St
- 400 South St
- 4832 E 200 N
- 3054 E 250 N
- 809 Deerfield Rd
- 2438 E 200 N
- 701 Westgate Dr
- 8900 W Sater St