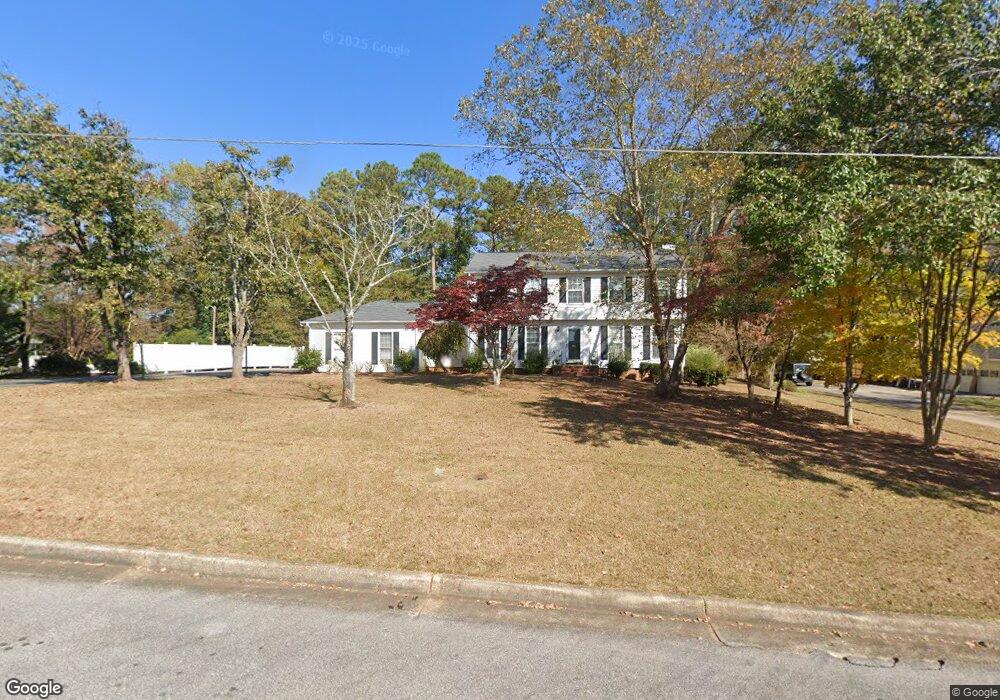
806 Wisteria Way Lagrange, GA 30240
Estimated Value: $370,788 - $452,000
5
Beds
3
Baths
3,014
Sq Ft
$139/Sq Ft
Est. Value
About This Home
This home is located at 806 Wisteria Way, Lagrange, GA 30240 and is currently estimated at $419,447, approximately $139 per square foot. 806 Wisteria Way is a home located in Troup County with nearby schools including Hollis Hand Elementary School, Franklin Forest Elementary School, and Ethel W. Kight Elementary School.
Ownership History
Date
Name
Owned For
Owner Type
Purchase Details
Closed on
Aug 1, 1994
Sold by
Irving Benard Thompson Jr Etal
Bought by
Hiers Mark A and Hiers Patsy W
Current Estimated Value
Purchase Details
Closed on
Aug 1, 1985
Sold by
Inman Billy E and Inman Ursula R
Bought by
Irving Benard Thompson Jr Etal
Purchase Details
Closed on
Jun 11, 1983
Sold by
Keneth A Wright
Bought by
Inman Billy E and Inman Ursula R
Purchase Details
Closed on
Dec 22, 1980
Sold by
Michael J Hanley
Bought by
Keneth A Wright
Purchase Details
Closed on
Jun 2, 1977
Sold by
Carol Ruben and Carol Strickland
Bought by
Michael J Hanley
Purchase Details
Closed on
Oct 4, 1976
Sold by
Mccaffery
Bought by
Carol Ruben and Carol Strickland
Purchase Details
Closed on
Jan 1, 1974
Sold by
Gaylord
Bought by
Mccaffery
Purchase Details
Closed on
Jan 1, 1972
Sold by
Carl A Buchanan Etal
Bought by
Gaylord
Create a Home Valuation Report for This Property
The Home Valuation Report is an in-depth analysis detailing your home's value as well as a comparison with similar homes in the area
Purchase History
| Date | Buyer | Sale Price | Title Company |
|---|---|---|---|
| Hiers Mark A | $158,800 | -- | |
| Irving Benard Thompson Jr Etal | $125,300 | -- | |
| Inman Billy E | -- | -- | |
| Keneth A Wright | -- | -- | |
| Michael J Hanley | -- | -- | |
| Carol Ruben | -- | -- | |
| Mccaffery | -- | -- | |
| Gaylord | -- | -- |
Source: Public Records
Tax History
| Year | Tax Paid | Tax Assessment Tax Assessment Total Assessment is a certain percentage of the fair market value that is determined by local assessors to be the total taxable value of land and additions on the property. | Land | Improvement |
|---|---|---|---|---|
| 2025 | $3,309 | $159,840 | $18,000 | $141,840 |
| 2024 | $3,309 | $123,320 | $16,000 | $107,320 |
| 2023 | $2,953 | $110,280 | $16,000 | $94,280 |
| 2022 | $2,751 | $100,560 | $16,000 | $84,560 |
| 2021 | $2,197 | $74,840 | $16,000 | $58,840 |
| 2020 | $2,197 | $74,840 | $16,000 | $58,840 |
| 2019 | $2,255 | $76,760 | $16,000 | $60,760 |
| 2018 | $2,168 | $73,880 | $16,000 | $57,880 |
| 2017 | $2,033 | $69,400 | $16,000 | $53,400 |
| 2016 | $2,039 | $69,605 | $16,000 | $53,605 |
| 2015 | $2,043 | $69,605 | $16,000 | $53,605 |
| 2014 | $1,890 | $64,436 | $16,000 | $48,436 |
| 2013 | -- | $70,673 | $16,000 | $54,673 |
Source: Public Records
Map
Nearby Homes
- 203 S Chilton Crescent
- 201 S Chilton Crescent
- 732 Camellia Dr
- 724 Camellia Dr
- 106 Ewing St
- 116 Wisteria Ridge Terrace
- 102 Beech Creek Dr
- 204 Dixie Creek Dr
- 222 Beechwood Cir
- 204 Colonial St
- 110 Russell St
- 900 North St
- 109 Thomas St
- 705 Piney Woods Dr
- 806 New Franklin Rd
- 219 Banks St
- 104 Sweetgum Dr
- 114 Briarcliff Rd
- 120 Saynor Cir
- 1784 Mooty Bridge Rd
- 808 Wisteria Way
- 807 Camellia Dr
- 805 Wisteria Way
- 802 Wisteria Way
- 809 Camellia Dr
- 803 Wisteria Way
- 807 Wisteria Way
- 811 Camellia Dr
- 803 Camellia Dr
- 809 Wisteria Way
- 299 Ivydale Dr
- 301 Ivydale Dr
- 801 Wisteria Way
- 303 Ivydale Dr
- 808 Camellia Dr
- 812 Azalea Dr
- 806 Camellia Dr
- 305 Ivydale Dr
- 816 Azalea Dr
- 811 Wisteria Way
Your Personal Tour Guide
Ask me questions while you tour the home.