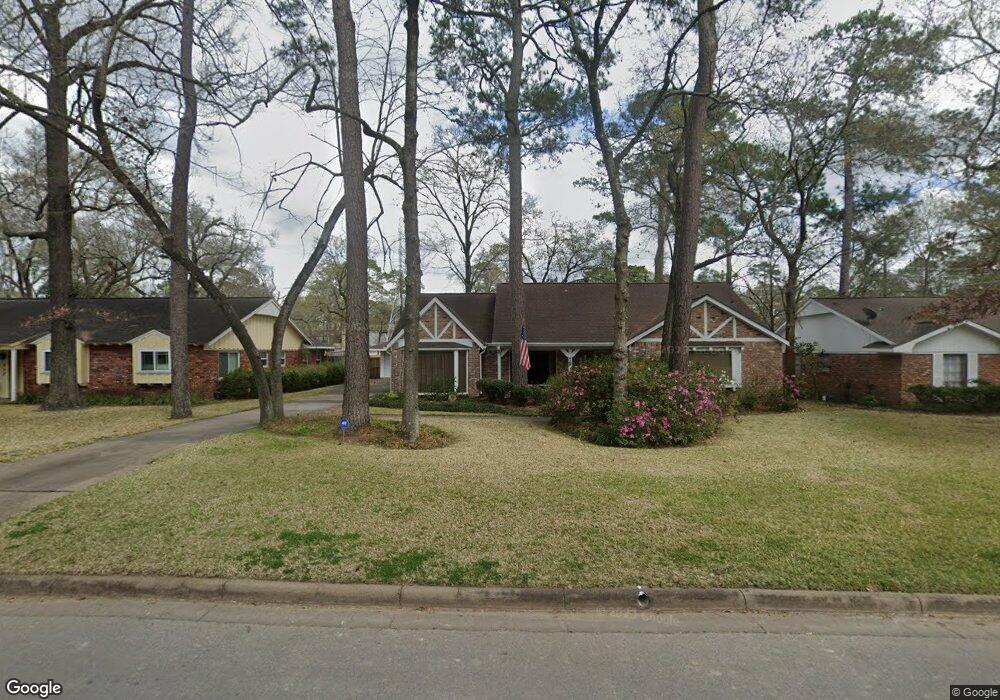
806 Wycliffe Dr Houston, TX 77079
Memorial NeighborhoodEstimated Value: $753,000 - $937,000
3
Beds
2
Baths
2,169
Sq Ft
$401/Sq Ft
Est. Value
About This Home
This home is located at 806 Wycliffe Dr, Houston, TX 77079 and is currently estimated at $870,028, approximately $401 per square foot. 806 Wycliffe Dr is a home located in Harris County with nearby schools including Rummel Creek Elementary School, Memorial Middle, and Stratford High School.
Ownership History
Date
Name
Owned For
Owner Type
Purchase Details
Closed on
Feb 16, 2017
Sold by
Krekeler Frank A and Krekeler Paige E
Bought by
Clark Frances Stucin
Current Estimated Value
Purchase Details
Closed on
Apr 23, 2010
Sold by
Krekeler Frank A and Krekeler Paige E
Bought by
Krekeler Frank A and Krekeler Paige E
Home Financials for this Owner
Home Financials are based on the most recent Mortgage that was taken out on this home.
Original Mortgage
$173,331
Interest Rate
4.93%
Mortgage Type
Credit Line Revolving
Purchase Details
Closed on
Feb 28, 1997
Sold by
Nazarenus Stephen J and Nazarenus Media B
Bought by
Krekeler Frank A and Chapman Paige E
Home Financials for this Owner
Home Financials are based on the most recent Mortgage that was taken out on this home.
Original Mortgage
$153,900
Interest Rate
7.92%
Create a Home Valuation Report for This Property
The Home Valuation Report is an in-depth analysis detailing your home's value as well as a comparison with similar homes in the area
Home Values in the Area
Average Home Value in this Area
Purchase History
| Date | Buyer | Sale Price | Title Company |
|---|---|---|---|
| Clark Frances Stucin | -- | None Available | |
| Krekeler Frank A | -- | Orange Coast Title | |
| Krekeler Frank A | -- | American Title Company |
Source: Public Records
Mortgage History
| Date | Status | Borrower | Loan Amount |
|---|---|---|---|
| Previous Owner | Krekeler Frank A | $173,331 | |
| Previous Owner | Krekeler Frank A | $153,900 |
Source: Public Records
Tax History Compared to Growth
Tax History
| Year | Tax Paid | Tax Assessment Tax Assessment Total Assessment is a certain percentage of the fair market value that is determined by local assessors to be the total taxable value of land and additions on the property. | Land | Improvement |
|---|---|---|---|---|
| 2025 | $7,429 | $958,501 | $493,920 | $464,581 |
| 2024 | $7,429 | $950,023 | $493,920 | $456,103 |
| 2023 | $7,429 | $1,051,898 | $493,920 | $557,978 |
| 2022 | $16,616 | $754,000 | $446,880 | $307,120 |
| 2021 | $15,804 | $647,325 | $423,360 | $223,965 |
| 2020 | $14,847 | $592,538 | $423,360 | $169,178 |
| 2019 | $14,205 | $542,594 | $423,360 | $119,234 |
| 2018 | $6,639 | $542,594 | $423,360 | $119,234 |
| 2017 | $14,195 | $542,594 | $423,360 | $119,234 |
| 2016 | $12,700 | $542,594 | $423,360 | $119,234 |
| 2015 | $8,333 | $542,594 | $423,360 | $119,234 |
| 2014 | $8,333 | $467,050 | $352,800 | $114,250 |
Source: Public Records
Map
Nearby Homes
- 807 Wycliffe Dr
- 903 Wycliffe Dr
- 13131 Kimberley Ln
- 866 Myrtlea Ln
- 921 Wax Myrtle Ln
- 939 Wax Myrtle Ln
- 839 Wax Myrtle Ln
- 903 Wax Myrtle Ln
- 893 Wax Myrtle Ln Unit 3
- 13403 Taylorcrest Rd
- 13346 Trail Hollow Dr Unit 3346
- 12984 Trail Hollow Dr Unit 2984
- 13282 Trail Hollow Dr Unit 3282
- 12978 Trail Hollow Dr Unit 2978
- 13228 Trail Hollow Dr Unit 3228
- 13316 Trail Hollow Dr Unit 3316
- 12971 Trail Hollow Dr Unit A
- 832 Wax Myrtle Ln Unit 832
- 12973 Trail Hollow Dr Unit A
- 414 E Gaywood Dr
- 810 Wycliffe Dr
- 802 Wycliffe Dr
- 814 Wycliffe Dr
- 738 Wycliffe Dr
- 811 Wycliffe Dr
- 803 Wycliffe Dr
- 818 Wycliffe Dr
- 815 Wycliffe Dr
- 13174 Barryknoll Ln
- 10938 Leaning Ash Ln
- 734 Wycliffe Dr
- 739 Wycliffe Dr
- 819 Wycliffe Dr
- 822 Wycliffe Dr
- 13175 Barryknoll Ln
- 13170 Barryknoll Ln
- 834 N Wilcrest Dr
- 838 N Wilcrest Dr
- 830 N Wilcrest Dr
- 735 Wycliffe Dr