8060 W 894 S Fairmount, IN 46928
Estimated Value: $119,755 - $167,000
3
Beds
1
Bath
1,480
Sq Ft
$98/Sq Ft
Est. Value
About This Home
This home is located at 8060 W 894 S, Fairmount, IN 46928 and is currently estimated at $144,939, approximately $97 per square foot. 8060 W 894 S is a home located in Grant County with nearby schools including Madison-Grant Junior/Senior High School.
Ownership History
Date
Name
Owned For
Owner Type
Purchase Details
Closed on
Feb 1, 2010
Sold by
Federal National Mortgage Association
Bought by
Blessing Jeffrey S and Blessing Rebecca S
Current Estimated Value
Home Financials for this Owner
Home Financials are based on the most recent Mortgage that was taken out on this home.
Original Mortgage
$18,750
Interest Rate
5.09%
Mortgage Type
Future Advance Clause Open End Mortgage
Purchase Details
Closed on
Jun 11, 2009
Sold by
Arenas Jesse
Bought by
Federal National Mortgage Association
Purchase Details
Closed on
Jun 9, 2009
Sold by
Himelick Sheriff Darrell L
Bought by
Attorney Craig E Beougher
Create a Home Valuation Report for This Property
The Home Valuation Report is an in-depth analysis detailing your home's value as well as a comparison with similar homes in the area
Purchase History
| Date | Buyer | Sale Price | Title Company |
|---|---|---|---|
| Blessing Jeffrey S | -- | None Available | |
| Federal National Mortgage Association | $85,920 | None Available | |
| Attorney Craig E Beougher | $85,921 | Feiwell & Hannoy |
Source: Public Records
Mortgage History
| Date | Status | Borrower | Loan Amount |
|---|---|---|---|
| Closed | Blessing Jeffrey S | $18,750 |
Source: Public Records
Tax History
| Year | Tax Paid | Tax Assessment Tax Assessment Total Assessment is a certain percentage of the fair market value that is determined by local assessors to be the total taxable value of land and additions on the property. | Land | Improvement |
|---|---|---|---|---|
| 2024 | $938 | $81,200 | $11,800 | $69,400 |
| 2023 | $823 | $78,100 | $11,800 | $66,300 |
| 2022 | $865 | $74,700 | $11,800 | $62,900 |
| 2021 | $991 | $68,700 | $11,800 | $56,900 |
| 2020 | $875 | $68,100 | $11,800 | $56,300 |
| 2019 | $886 | $69,000 | $10,300 | $58,700 |
| 2018 | $871 | $69,000 | $10,300 | $58,700 |
| 2017 | $852 | $68,500 | $10,300 | $58,200 |
| 2016 | $782 | $68,500 | $10,300 | $58,200 |
| 2014 | $133 | $69,300 | $10,300 | $59,000 |
| 2013 | $133 | $69,000 | $10,300 | $58,700 |
Source: Public Records
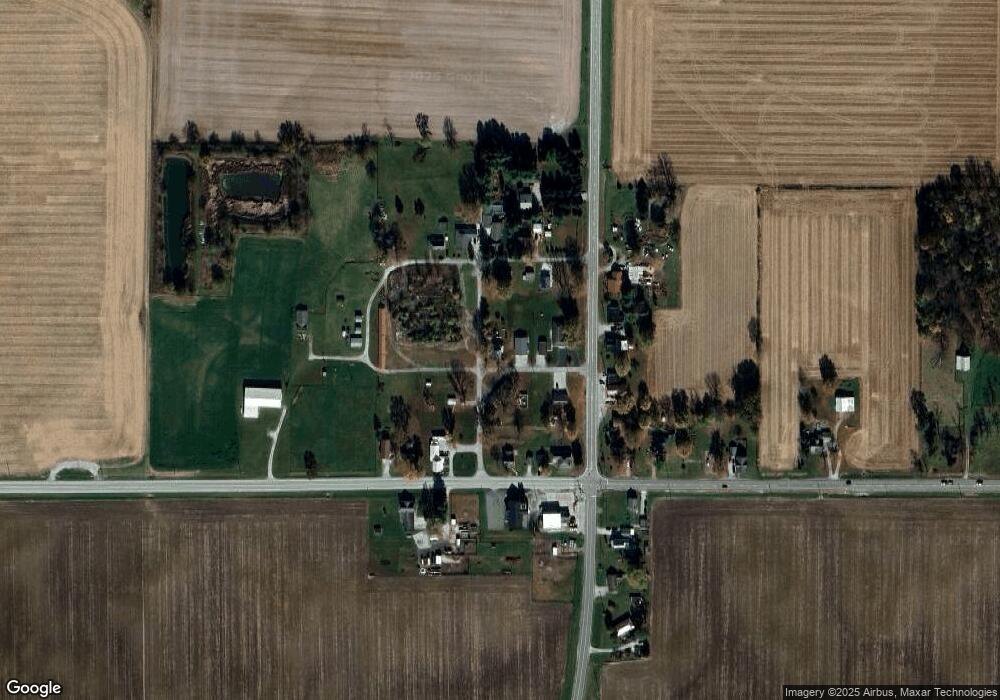
Map
Nearby Homes
- 8060 W 900 S
- 8011 S 800 W
- 9502 W 800 S
- 13972 County Road East 500 S
- 12631 E 300 S
- 6095 W 1900 N
- 6640 W 500 S
- 3948 S 1100 E
- 10955 E 400 S
- 207 W Lincoln St
- 1263 N 1350 E
- 203 E Lyons St
- 3893 E 650 N
- 11766 E 100 N
- 11591 S 200 W
- 8937 E 300 S
- TBD W 1900 N
- 1009 Eastcrest Dr
- 9095 E 00 Ns
- 415 N Independence St Unit Windfall
Your Personal Tour Guide
Ask me questions while you tour the home.