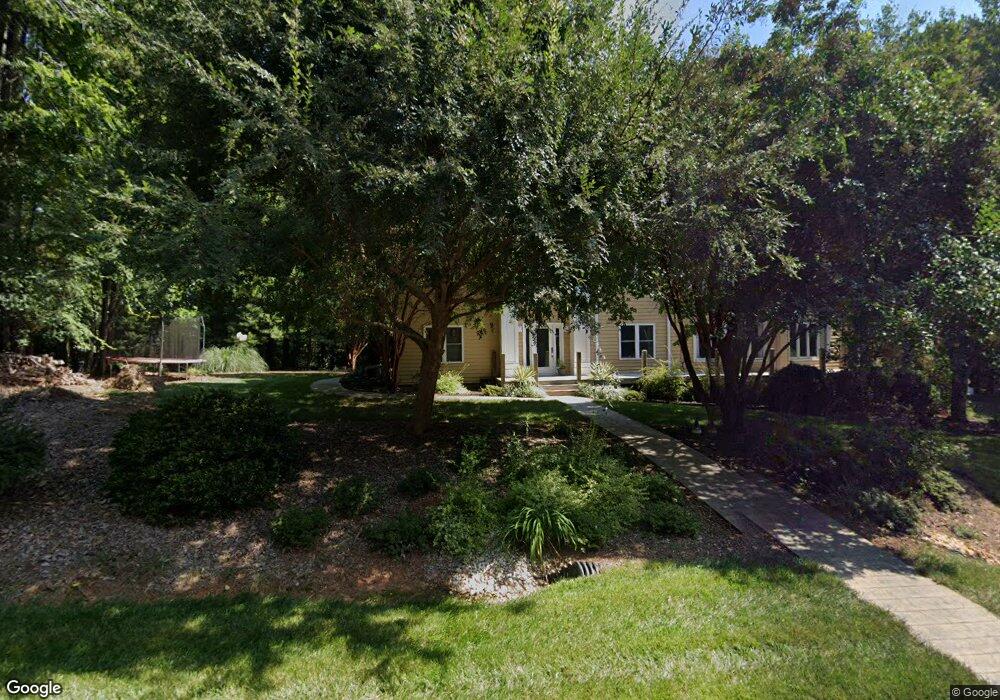
8061 Bradford Ln Denver, NC 28037
Estimated Value: $746,000 - $884,000
3
Beds
3
Baths
3,305
Sq Ft
$246/Sq Ft
Est. Value
About This Home
This home is located at 8061 Bradford Ln, Denver, NC 28037 and is currently estimated at $813,862, approximately $246 per square foot. 8061 Bradford Ln is a home located in Lincoln County with nearby schools including Rock Springs Elementary School, North Lincoln Middle School, and North Lincoln High School.
Ownership History
Date
Name
Owned For
Owner Type
Purchase Details
Closed on
Sep 26, 2025
Sold by
Stevens Eric J and Wisjo-Stevens Anna
Bought by
Stevens Eric J
Current Estimated Value
Purchase Details
Closed on
May 21, 2009
Sold by
Stevens Eric J and Wisjo Stevens Anna
Bought by
Stevens Eric J and Wisjo Stevens Anna
Home Financials for this Owner
Home Financials are based on the most recent Mortgage that was taken out on this home.
Original Mortgage
$365,600
Interest Rate
4.81%
Mortgage Type
New Conventional
Purchase Details
Closed on
May 30, 2006
Sold by
Frank Brian D and Grant Barbara
Bought by
Stevens Eric J
Home Financials for this Owner
Home Financials are based on the most recent Mortgage that was taken out on this home.
Original Mortgage
$246,400
Interest Rate
6.51%
Mortgage Type
New Conventional
Purchase Details
Closed on
Dec 29, 1999
Bought by
Frank Brian D and Frank Barbara
Purchase Details
Closed on
Mar 2, 1993
Bought by
Blajda John A
Create a Home Valuation Report for This Property
The Home Valuation Report is an in-depth analysis detailing your home's value as well as a comparison with similar homes in the area
Home Values in the Area
Average Home Value in this Area
Purchase History
| Date | Buyer | Sale Price | Title Company |
|---|---|---|---|
| Stevens Eric J | -- | None Listed On Document | |
| Stevens Eric J | -- | Investors Title | |
| Stevens Eric J | $313,000 | None Available | |
| Frank Brian D | $215,000 | -- | |
| Blajda John A | $156,000 | -- |
Source: Public Records
Mortgage History
| Date | Status | Borrower | Loan Amount |
|---|---|---|---|
| Previous Owner | Stevens Eric J | $365,600 | |
| Previous Owner | Stevens Eric J | $246,400 |
Source: Public Records
Tax History Compared to Growth
Tax History
| Year | Tax Paid | Tax Assessment Tax Assessment Total Assessment is a certain percentage of the fair market value that is determined by local assessors to be the total taxable value of land and additions on the property. | Land | Improvement |
|---|---|---|---|---|
| 2025 | $3,783 | $602,067 | $122,000 | $480,067 |
| 2024 | $3,750 | $602,067 | $122,000 | $480,067 |
| 2023 | $3,750 | $602,067 | $122,000 | $480,067 |
| 2022 | $3,385 | $441,361 | $97,500 | $343,861 |
| 2021 | $3,355 | $441,361 | $97,500 | $343,861 |
| 2020 | $3,151 | $441,361 | $97,500 | $343,861 |
| 2019 | $3,151 | $441,361 | $97,500 | $343,861 |
| 2018 | $2,624 | $347,538 | $99,000 | $248,538 |
| 2017 | $2,523 | $347,538 | $99,000 | $248,538 |
| 2016 | $2,514 | $347,538 | $99,000 | $248,538 |
| 2015 | $2,661 | $347,538 | $99,000 | $248,538 |
| 2014 | $2,954 | $394,580 | $121,500 | $273,080 |
Source: Public Records
Map
Nearby Homes
- 8065 Bay Pointe Dr
- 7980 Bradford Ln
- 4536 Rustling Woods Dr
- 8170 Bay Pointe Dr
- 4599 Rustling Woods Dr
- 7464 Albemarle Dr
- 3995 Burton Ln
- 3988 Channel Point Ln
- 7405 Albemarle Dr
- 7113 Spyglass Ridge Dr
- 4424 Augusta Ridge Ct
- 4628 Sierra View Dr
- 4511 Morning Dove Ct
- 4550 Osprey Run Ct
- 00 Hawkes Bay Ct Unit 121
- 00 Summit Ridge Ln
- 7246 Adirondack Dr
- 7193 Adirondack Dr
- 512 Stonemarker Rd
- 4120 Lake Shore Rd S
- 8087 Bradford Ln
- 8046 Bradford Ln
- 8081 Bay Pointe Dr
- 8081 Baypointe Dr
- 8095 Baypointe Dr
- 8074 Bradford Ln
- 8074 Bradford Ln Unit 5
- LOT 9 Bay Pointe Dr
- 8062 Bradford Ln
- 8111 Bradford Ln
- 8065 Baypointe Dr
- 8111 Baypointe Dr
- 8058 Westcape Dr
- 8056 Westcape Dr Unit F
- 8060 Westcape Dr
- 8060 Westcape Dr Unit 1084
- 8062 Westcape Dr
- 8046 Westcape Dr Unit 1076
- 8046 Westcape Dr
- 8049 Baypointe Dr