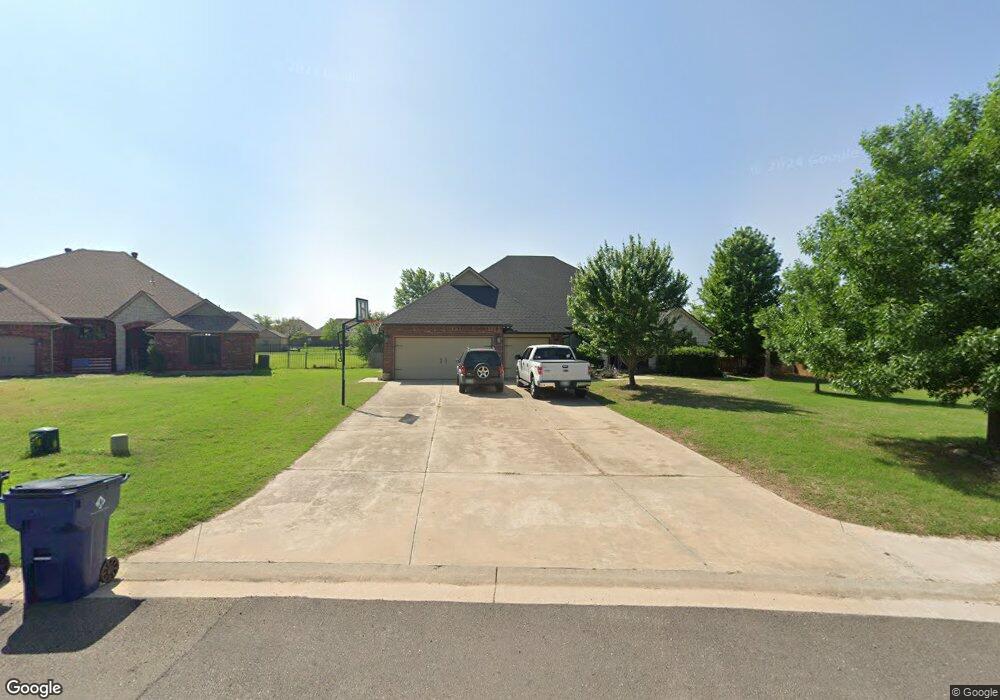
8061 Lindsay Ln Edmond, OK 73025
Waterloo NeighborhoodEstimated Value: $406,361 - $449,000
--
Bed
--
Bath
2,637
Sq Ft
$160/Sq Ft
Est. Value
About This Home
This home is located at 8061 Lindsay Ln, Edmond, OK 73025 and is currently estimated at $420,840, approximately $159 per square foot. 8061 Lindsay Ln is a home located in Logan County with nearby schools including Cross Timbers Elementary School, Sequoyah Middle School, and North High School.
Ownership History
Date
Name
Owned For
Owner Type
Purchase Details
Closed on
Apr 8, 2013
Sold by
Ritz Monique J and Donalue Edward Allan
Bought by
Jpmorgan Chase Bank Na
Current Estimated Value
Purchase Details
Closed on
Sep 18, 2012
Sold by
Ritz Moniqulie J
Bought by
Donahlie Edward Allan
Purchase Details
Closed on
Nov 1, 2007
Sold by
Corners Construction Llc
Bought by
Carpenter Chris A and Carpenter Robin
Home Financials for this Owner
Home Financials are based on the most recent Mortgage that was taken out on this home.
Original Mortgage
$227,250
Interest Rate
6.37%
Mortgage Type
New Conventional
Purchase Details
Closed on
May 4, 2007
Sold by
Kelly 160 Llc
Bought by
4 Corners Construction Llc
Home Financials for this Owner
Home Financials are based on the most recent Mortgage that was taken out on this home.
Original Mortgage
$194,443
Interest Rate
6.13%
Mortgage Type
Construction
Create a Home Valuation Report for This Property
The Home Valuation Report is an in-depth analysis detailing your home's value as well as a comparison with similar homes in the area
Home Values in the Area
Average Home Value in this Area
Purchase History
| Date | Buyer | Sale Price | Title Company |
|---|---|---|---|
| Jpmorgan Chase Bank Na | $218,562 | None Available | |
| Donahlie Edward Allan | -- | None Available | |
| Carpenter Chris A | $239,500 | The Oklahoma City Abstract & | |
| 4 Corners Construction Llc | $35,000 | None Available |
Source: Public Records
Mortgage History
| Date | Status | Borrower | Loan Amount |
|---|---|---|---|
| Previous Owner | Carpenter Chris A | $227,250 | |
| Previous Owner | 4 Corners Construction Llc | $194,443 |
Source: Public Records
Tax History Compared to Growth
Tax History
| Year | Tax Paid | Tax Assessment Tax Assessment Total Assessment is a certain percentage of the fair market value that is determined by local assessors to be the total taxable value of land and additions on the property. | Land | Improvement |
|---|---|---|---|---|
| 2024 | $3,425 | $32,017 | $4,338 | $27,679 |
| 2023 | $3,425 | $30,492 | $4,338 | $26,154 |
| 2022 | $3,017 | $29,040 | $4,338 | $24,702 |
| 2021 | $2,925 | $28,260 | $4,338 | $23,922 |
| 2020 | $2,807 | $26,914 | $4,338 | $22,576 |
| 2019 | $2,805 | $26,798 | $4,591 | $22,207 |
| 2018 | $2,818 | $26,798 | $4,591 | $22,207 |
| 2017 | $2,868 | $27,304 | $4,591 | $22,713 |
| 2016 | $2,825 | $27,081 | $4,591 | $22,490 |
| 2014 | $2,835 | $27,201 | $4,189 | $23,012 |
| 2013 | -- | $29,180 | $4,200 | $24,980 |
Source: Public Records
Map
Nearby Homes
- 8039 Lindsay Ln
- 7933 Lindsay Ln
- 6160 Lincoln Rd
- 7405 Niblick Way
- 7409 Mid Iron Ln
- 1200 Chipper Ln
- 1308 Chipper Ln
- 2500 Blue Spruce Rd
- 9071 Oak Tree Cir
- 309 Oak Summit Rd
- 2520 Silverfield Ln
- 6525 Oak Heritage
- 7250 Falcon Ridge
- 6108 Oak Tree Rd
- 913 Oak Tree Dr
- 360 Old Farm Rd
- 7402 Coyote Point
- 6201 Canopy Ln
- 6104 Laquinta Dr
- 10050 Santa fe Trail
- 8053 Lindsay Ln
- 8079 Lindsay Ln
- 8047 Lindsay Ln
- 1367 Skyline Blvd
- 7855 Lindsay Ln
- 8066 Lindsay Ln
- 7867 Lindsay Ln
- 7843 Lindsay Ln
- 1313 Skyline Blvd
- 8038 Lindsay Ln
- 7881 Lindsay Ln
- 1287 Skyline Blvd
- 8084 Lindsay Ln
- 7831 Lindsay Ln
- 7897 Lindsay Ln
- 8015 Lindsay Ln
- 8116 Lindsay Ln
- 7919 Lindsay Ln
- 1372 Skyline Blvd
- 7842 Lindsay Ln