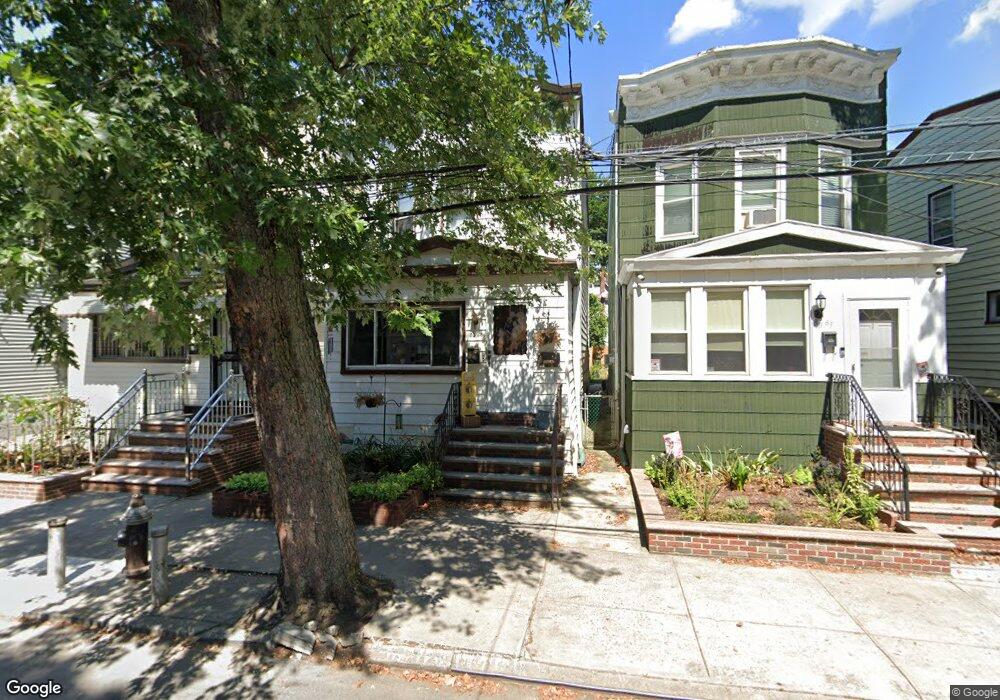
8063 88th Rd Woodhaven, NY 11421
Woodhaven NeighborhoodEstimated Value: $615,000 - $772,000
--
Bed
--
Bath
1,480
Sq Ft
$459/Sq Ft
Est. Value
About This Home
This home is located at 8063 88th Rd, Woodhaven, NY 11421 and is currently estimated at $678,749, approximately $458 per square foot. 8063 88th Rd is a home located in Queens County with nearby schools including P.S. 060 Woodhaven, Jhs 210 Elizabeth Blackwell, and St. Thomas the Apostle Catholic Academy.
Ownership History
Date
Name
Owned For
Owner Type
Purchase Details
Closed on
Dec 19, 2022
Sold by
Mannix Lawrence J and Mannix Thomas P
Bought by
Norbu Thinley and Sherpa Pema
Current Estimated Value
Home Financials for this Owner
Home Financials are based on the most recent Mortgage that was taken out on this home.
Original Mortgage
$572,343
Outstanding Balance
$554,070
Interest Rate
6.61%
Mortgage Type
Purchase Money Mortgage
Estimated Equity
$124,679
Purchase Details
Closed on
Oct 19, 2012
Sold by
Mannix Edward B
Bought by
Mannix Lawrence J and Mannix Thomas P
Create a Home Valuation Report for This Property
The Home Valuation Report is an in-depth analysis detailing your home's value as well as a comparison with similar homes in the area
Home Values in the Area
Average Home Value in this Area
Purchase History
| Date | Buyer | Sale Price | Title Company |
|---|---|---|---|
| Norbu Thinley | $625,000 | -- | |
| Norbu Thinley | $625,000 | -- | |
| Mannix Lawrence J | -- | -- | |
| Mannix Lawrence J | -- | -- |
Source: Public Records
Mortgage History
| Date | Status | Borrower | Loan Amount |
|---|---|---|---|
| Open | Norbu Thinley | $572,343 | |
| Closed | Norbu Thinley | $572,343 |
Source: Public Records
Tax History Compared to Growth
Tax History
| Year | Tax Paid | Tax Assessment Tax Assessment Total Assessment is a certain percentage of the fair market value that is determined by local assessors to be the total taxable value of land and additions on the property. | Land | Improvement |
|---|---|---|---|---|
| 2025 | $5,181 | $27,337 | $8,643 | $18,694 |
| 2024 | $5,181 | $25,795 | $8,532 | $17,263 |
| 2023 | $5,181 | $25,795 | $7,867 | $17,928 |
| 2022 | $1,787 | $40,020 | $12,900 | $27,120 |
| 2021 | $1,881 | $38,400 | $12,900 | $25,500 |
| 2020 | $1,752 | $36,720 | $12,900 | $23,820 |
| 2019 | $1,589 | $35,220 | $12,900 | $22,320 |
| 2018 | $1,532 | $21,496 | $9,299 | $12,197 |
| 2017 | $1,435 | $20,420 | $9,243 | $11,177 |
| 2016 | $1,390 | $20,420 | $9,243 | $11,177 |
| 2015 | $723 | $18,984 | $10,986 | $7,998 |
| 2014 | $723 | $17,914 | $12,446 | $5,468 |
Source: Public Records
Map
Nearby Homes