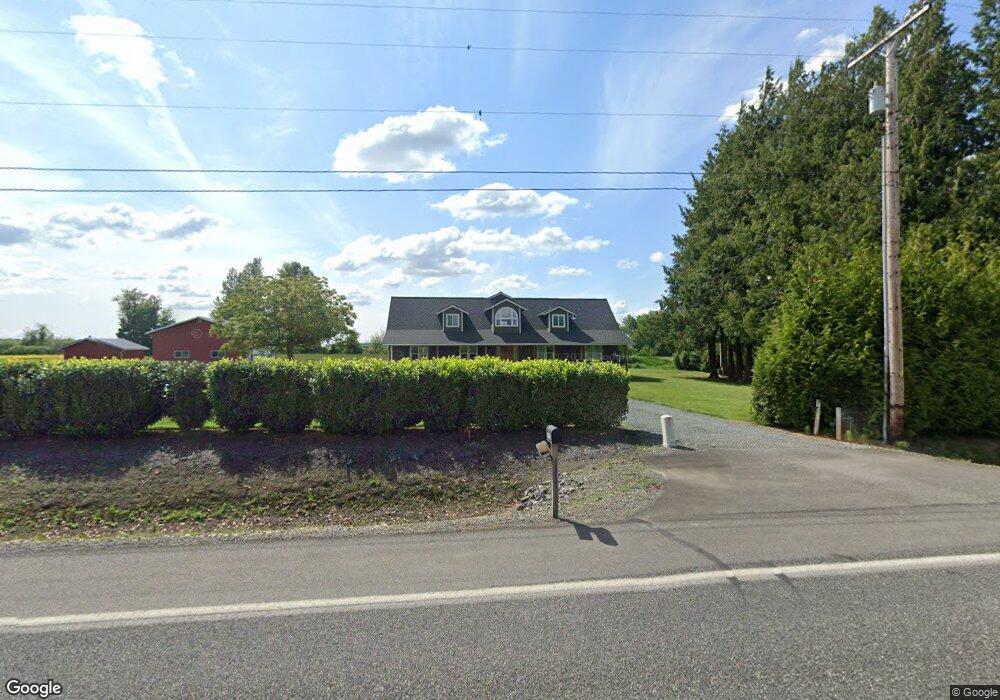
8063 Van Buren Rd Everson, WA 98247
Estimated Value: $676,000 - $977,301
3
Beds
3
Baths
3,300
Sq Ft
$245/Sq Ft
Est. Value
About This Home
This home is located at 8063 Van Buren Rd, Everson, WA 98247 and is currently estimated at $810,075, approximately $245 per square foot. 8063 Van Buren Rd is a home located in Whatcom County with nearby schools including Everson Elementary School, Nooksack Elementary School, and Sumas Elementary School.
Ownership History
Date
Name
Owned For
Owner Type
Purchase Details
Closed on
Jan 17, 2012
Sold by
Tjoelker Kent J
Bought by
Tjoelker Kent J and Tjoelker Jessica F
Current Estimated Value
Home Financials for this Owner
Home Financials are based on the most recent Mortgage that was taken out on this home.
Original Mortgage
$213,500
Outstanding Balance
$83,132
Interest Rate
3.88%
Mortgage Type
New Conventional
Estimated Equity
$726,943
Purchase Details
Closed on
Sep 24, 2003
Sold by
Tiemersma Harry and Tiermersma Marie
Bought by
Tjoelker Kent
Home Financials for this Owner
Home Financials are based on the most recent Mortgage that was taken out on this home.
Original Mortgage
$95,000
Interest Rate
6.17%
Mortgage Type
Seller Take Back
Purchase Details
Closed on
Jun 13, 2001
Sold by
Pearson Donna J
Bought by
Tiemersma Harry and Tiemersma Marie
Create a Home Valuation Report for This Property
The Home Valuation Report is an in-depth analysis detailing your home's value as well as a comparison with similar homes in the area
Purchase History
| Date | Buyer | Sale Price | Title Company |
|---|---|---|---|
| Tjoelker Kent J | -- | Chicago Title Company | |
| Tjoelker Kent | -- | Chicago Title Insurance | |
| Tiemersma Harry | -- | First American Title Ins Co |
Source: Public Records
Mortgage History
| Date | Status | Borrower | Loan Amount |
|---|---|---|---|
| Open | Tjoelker Kent J | $213,500 | |
| Closed | Tjoelker Kent | $95,000 |
Source: Public Records
Tax History
| Year | Tax Paid | Tax Assessment Tax Assessment Total Assessment is a certain percentage of the fair market value that is determined by local assessors to be the total taxable value of land and additions on the property. | Land | Improvement |
|---|---|---|---|---|
| 2025 | $8,038 | $859,651 | $334,978 | $524,673 |
| 2024 | $9,001 | $843,537 | $331,661 | $511,876 |
| 2023 | $9,001 | $993,489 | $328,379 | $665,110 |
| 2022 | $7,947 | $895,051 | $295,843 | $599,208 |
| 2021 | $7,631 | $699,243 | $231,122 | $468,121 |
| 2020 | $6,672 | $592,579 | $195,866 | $396,713 |
| 2019 | $5,668 | $534,905 | $176,803 | $358,102 |
| 2018 | $6,362 | $510,844 | $168,850 | $341,994 |
| 2017 | $5,484 | $440,680 | $121,322 | $319,358 |
| 2016 | $5,471 | $392,619 | $108,090 | $284,529 |
| 2015 | $4,556 | $392,619 | $108,090 | $284,529 |
| 2014 | -- | $370,068 | $101,882 | $268,186 |
| 2013 | -- | $364,152 | $100,253 | $263,899 |
Source: Public Records
Map
Nearby Homes
- 702 N Washington St
- 409 W 4th St
- 303 Hayes St
- 408 W 3rd St
- 416 W 3rd St
- 108 Baker St Unit 1-4
- 207 E Main St
- 412 W 3rd St
- 404 W 3rd St
- 308 W 3rd St
- 0 Walnut Grove Ct
- 304 W 3rd St
- 107 Thendara Park Dr Unit C
- 107 River St
- 109 W 2nd St
- 407 E 2nd St
- 209 Nooksack Ave
- 512 Allison Way
- 705 E 6th St
- 1915 Hampton Rd
- 8078 Van Buren Rd
- 8101 Van Buren Rd
- 2721 Tom Rd
- 8116 Van Buren Rd
- 2757 Tom Rd
- 7960 Van Buren Rd
- 8173 Van Buren Rd
- 8172 Van Buren Rd
- 8198 Van Buren Rd
- 2830 Tom Rd
- 7921 Van Buren Rd
- 8076 Trapline Rd
- 8118 Trapline Rd
- 8232 Van Buren Rd
- 2864 Tom Rd
- 7956 Trapline Rd
- 8083 Trapline Rd
- 8252 Van Buren Rd
- 8039 Trapline Rd
Your Personal Tour Guide
Ask me questions while you tour the home.