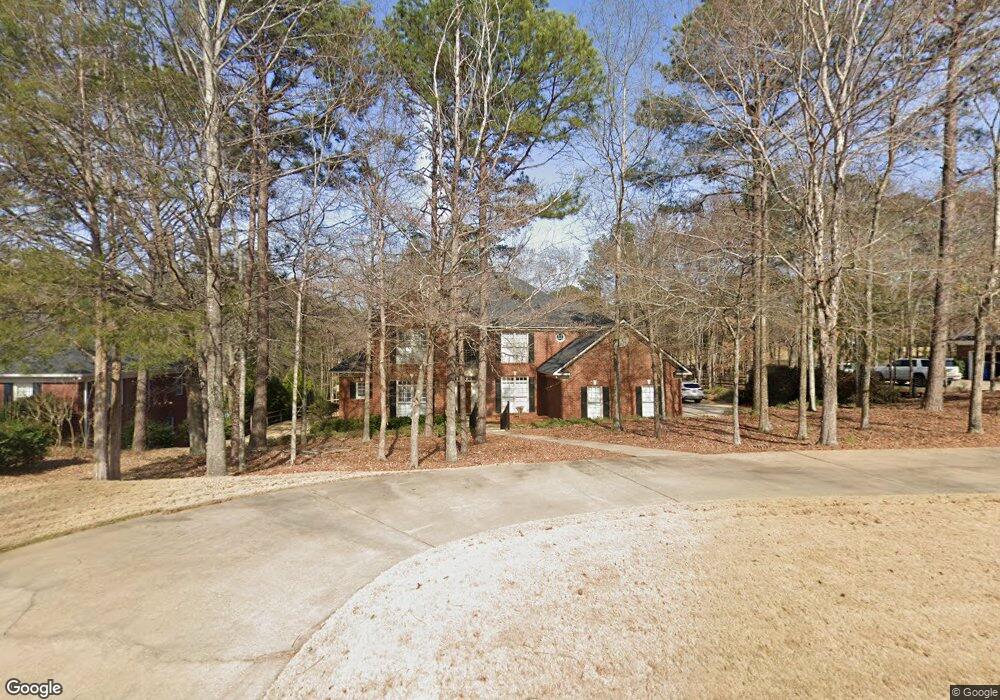
8064 Innisbrook Ct Columbus, GA 31909
Northern Columbus NeighborhoodEstimated Value: $509,000 - $627,000
4
Beds
5
Baths
3,922
Sq Ft
$143/Sq Ft
Est. Value
About This Home
This home is located at 8064 Innisbrook Ct, Columbus, GA 31909 and is currently estimated at $562,322, approximately $143 per square foot. 8064 Innisbrook Ct is a home located in Muscogee County with nearby schools including Eagle Ridge Academy, Blackmon Road Middle School, and Shaw High School.
Ownership History
Date
Name
Owned For
Owner Type
Purchase Details
Closed on
Apr 22, 2009
Sold by
Wright Allen T
Bought by
Wright Melissa M
Current Estimated Value
Home Financials for this Owner
Home Financials are based on the most recent Mortgage that was taken out on this home.
Original Mortgage
$212,000
Outstanding Balance
$134,808
Interest Rate
5.05%
Mortgage Type
Purchase Money Mortgage
Estimated Equity
$427,514
Purchase Details
Closed on
Apr 21, 2009
Sold by
Wright Melissa M
Bought by
Wright Allen T
Home Financials for this Owner
Home Financials are based on the most recent Mortgage that was taken out on this home.
Original Mortgage
$212,000
Outstanding Balance
$134,808
Interest Rate
5.05%
Mortgage Type
Purchase Money Mortgage
Estimated Equity
$427,514
Purchase Details
Closed on
Dec 15, 2008
Sold by
Wright Allen T
Bought by
Wright Melissa M
Purchase Details
Closed on
Nov 18, 2008
Sold by
Wright Allen T
Bought by
Wright Melissa M
Create a Home Valuation Report for This Property
The Home Valuation Report is an in-depth analysis detailing your home's value as well as a comparison with similar homes in the area
Home Values in the Area
Average Home Value in this Area
Purchase History
| Date | Buyer | Sale Price | Title Company |
|---|---|---|---|
| Wright Melissa M | -- | None Available | |
| Wright Allen T | -- | None Available | |
| Wright Melissa M | -- | None Available | |
| Wright Melissa M | -- | None Available |
Source: Public Records
Mortgage History
| Date | Status | Borrower | Loan Amount |
|---|---|---|---|
| Open | Wright Allen T | $212,000 |
Source: Public Records
Tax History Compared to Growth
Tax History
| Year | Tax Paid | Tax Assessment Tax Assessment Total Assessment is a certain percentage of the fair market value that is determined by local assessors to be the total taxable value of land and additions on the property. | Land | Improvement |
|---|---|---|---|---|
| 2025 | $5,089 | $198,548 | $32,892 | $165,656 |
| 2024 | $5,087 | $198,548 | $32,892 | $165,656 |
| 2023 | $4,425 | $198,548 | $32,892 | $165,656 |
| 2022 | $5,306 | $159,416 | $32,892 | $126,524 |
| 2021 | $5,299 | $165,364 | $32,892 | $132,472 |
| 2020 | $5,301 | $165,364 | $32,892 | $132,472 |
| 2019 | $5,319 | $165,364 | $32,892 | $132,472 |
| 2018 | $5,319 | $165,364 | $32,892 | $132,472 |
| 2017 | $5,338 | $165,364 | $32,892 | $132,472 |
| 2016 | $5,359 | $143,176 | $24,004 | $119,172 |
| 2015 | $5,366 | $143,176 | $24,004 | $119,172 |
| 2014 | $5,373 | $143,176 | $24,004 | $119,172 |
| 2013 | -- | $143,176 | $24,004 | $119,172 |
Source: Public Records
Map
Nearby Homes
- 4880 Turnberry Ln
- 4701 Turnberry Ln Unit 6
- 8039 Adelaide Dr
- 4756 Timarron Loop
- 7933 Prestwick Ct
- 4691 Talamore Ln
- 8000 Cooper Creek Rd
- 4840 Spring Ridge Dr
- 4848 Spring Ridge Dr
- 8049 Cooper Creek Rd
- 4854 Champions Way
- 8507 Galena Rd
- 7847 Kolven Cove
- 7807 Kolven Cove
- 2040 Old Guard Rd
- 8082 Veterans Pkwy
- 8848 Promenade Place
- 4764 Bridlewood Dr
- 3806 Sunrise Ln
- 3767 Cardinal Landing Dr
- 8072 Innisbrook Ct
- 8080 Innisbrook Ct
- 8056 Innisbrook Ct
- 8065 Innisbrook Ct
- 8057 Innisbrook Ct
- 8077 Innisbrook Ct
- 8048 Innisbrook Ct
- 8040 Innisbrook Ct
- 8049 Innisbrook Ct
- 4865 Turnberry Ln
- 4857 Turnberry Ln
- 8041 Innisbrook Ct
- 4841 Turnberry Ln
- 4871 Turnberry Ln
- 4849 Turnberry Ln
- 4877 Turnberry Ln
- 8032 Innisbrook Ct
- 4885 Turnberry Ln
- 4891 Turnberry Ln
- 4835 Turnberry Ln