8064 Whispering Hills NE Unit C Rockford, MI 49341
Estimated Value: $467,000 - $521,000
3
Beds
3
Baths
1,385
Sq Ft
$356/Sq Ft
Est. Value
About This Home
This home is located at 8064 Whispering Hills NE Unit C, Rockford, MI 49341 and is currently estimated at $493,690, approximately $356 per square foot. 8064 Whispering Hills NE Unit C is a home located in Kent County with nearby schools including Lakes Elementary School, East Rockford Middle School, and Rockford High School Freshman Center.
Ownership History
Date
Name
Owned For
Owner Type
Purchase Details
Closed on
Aug 15, 2023
Sold by
Willman Hugh M and Willman Lora J
Bought by
Misic Family Trust and Misic
Current Estimated Value
Home Financials for this Owner
Home Financials are based on the most recent Mortgage that was taken out on this home.
Original Mortgage
$345,600
Outstanding Balance
$337,458
Interest Rate
6.63%
Mortgage Type
New Conventional
Estimated Equity
$156,232
Purchase Details
Closed on
Jul 2, 1998
Sold by
Kozycki Cynthia
Bought by
Hugh and Lora Willman
Purchase Details
Closed on
Feb 7, 1996
Sold by
Andrew Kozycki and Foss Cynthia
Bought by
Andrew and Cynthia Kozycki
Purchase Details
Closed on
Dec 19, 1994
Sold by
Hoffman Julie
Bought by
Andrew Kozycki and Cynthia Foss
Purchase Details
Closed on
Mar 25, 1994
Sold by
Veronica Valadislas and Visockis Veronica
Bought by
Dushane R and Dushane L
Purchase Details
Closed on
Dec 22, 1993
Sold by
Dushane R and Dushane L
Bought by
Alan and Julie Hoffman
Create a Home Valuation Report for This Property
The Home Valuation Report is an in-depth analysis detailing your home's value as well as a comparison with similar homes in the area
Home Values in the Area
Average Home Value in this Area
Purchase History
| Date | Buyer | Sale Price | Title Company |
|---|---|---|---|
| Misic Family Trust | $432,000 | Chicago Title | |
| Hugh | $160,000 | -- | |
| Andrew | -- | -- | |
| Andrew Kozycki | $147,000 | -- | |
| Dushane R | $18,500 | -- | |
| Alan | $18,500 | -- |
Source: Public Records
Mortgage History
| Date | Status | Borrower | Loan Amount |
|---|---|---|---|
| Open | Misic Family Trust | $345,600 |
Source: Public Records
Tax History Compared to Growth
Tax History
| Year | Tax Paid | Tax Assessment Tax Assessment Total Assessment is a certain percentage of the fair market value that is determined by local assessors to be the total taxable value of land and additions on the property. | Land | Improvement |
|---|---|---|---|---|
| 2025 | $4,296 | $215,300 | $0 | $0 |
| 2024 | $4,296 | $200,900 | $0 | $0 |
| 2023 | $2,549 | $171,500 | $0 | $0 |
| 2022 | $3,579 | $148,500 | $0 | $0 |
| 2021 | $3,440 | $138,100 | $0 | $0 |
| 2020 | $2,359 | $132,800 | $0 | $0 |
| 2019 | $3,368 | $126,900 | $0 | $0 |
| 2018 | $3,406 | $123,500 | $26,300 | $97,200 |
| 2017 | $3,318 | $116,400 | $0 | $0 |
| 2016 | $3,177 | $108,200 | $0 | $0 |
| 2015 | -- | $108,200 | $0 | $0 |
| 2013 | -- | $99,700 | $0 | $0 |
Source: Public Records
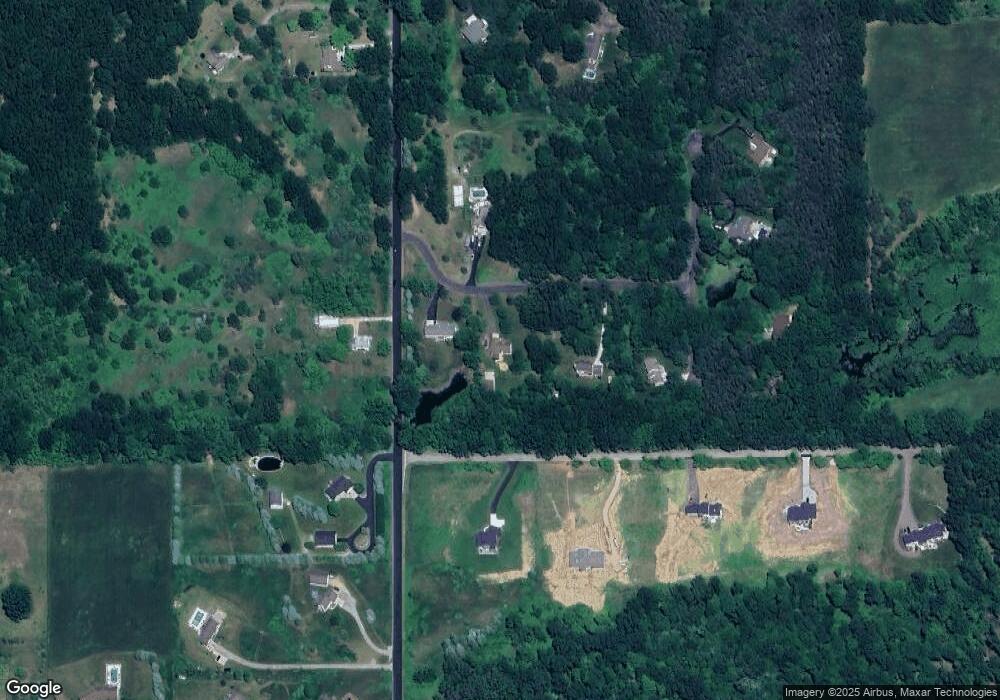
Map
Nearby Homes
- 7350 Young Ave NE
- 8315 Ramsdell Dr NE
- 8698 9 Mile Rd NE
- 8332 Ramsdell Dr NE
- Wilshire Plan at Villages of Silver Lake - Villages of Silver Lake
- Remington Plan at Villages of Silver Lake - Villages of Silver Lake
- Linden Plan at Villages of Silver Lake - Villages of Silver Lake
- Enclave Plan at Villages of Silver Lake - Villages of Silver Lake
- Croswell Plan at Villages of Silver Lake - Villages of Silver Lake
- Cascade Plan at Villages of Silver Lake - Villages of Silver Lake
- Carson Plan at Villages of Silver Lake - Villages of Silver Lake
- Avery Plan at Villages of Silver Lake - Villages of Silver Lake
- Ashton Plan at Villages of Silver Lake - Villages of Silver Lake
- Andover Plan at Villages of Silver Lake - Villages of Silver Lake
- Sycamore -2535 Plan at Villages of Silver Lake - Woodland Series
- Sycamore -2531 Plan at Villages of Silver Lake - Woodland Series
- Sycamore-2089 Plan at Villages of Silver Lake - Woodland Series
- Whitby Cottage Series Plan at Villages of Silver Lake - Cottage Series
- Sequoia Plan at Villages of Silver Lake - Woodland Series
- Redwood Plan at Villages of Silver Lake - Woodland Series
- 8064 Whispering Hills NE
- 8064 Whispering Hills NE
- 8020 Whispering Hills NE
- 8020 Whispering Hills NE
- 8020 Whispering Hills NE Unit B
- 8156 Whispering Hills Dr NE Unit G
- 8160 Whispering Hills Dr NE Unit H
- 8100 Whispering Hills NE
- 8225 Young Ave NE
- 8017 Whispering Hills NE
- 8158 Whispering Hills NE
- 8181 Young Ave NE
- 8212 Winterforest Dr NE
- 8170 Whispering Hills Dr NE
- 8170 Whispering Hills NE
- 8178 Whispering Hills NE
- 8178 Whispering Hills Dr NE
- 8190 Whispering Hills NE
- 8190 Whispering Hills Dr NE
- 8155 Young Ave NE