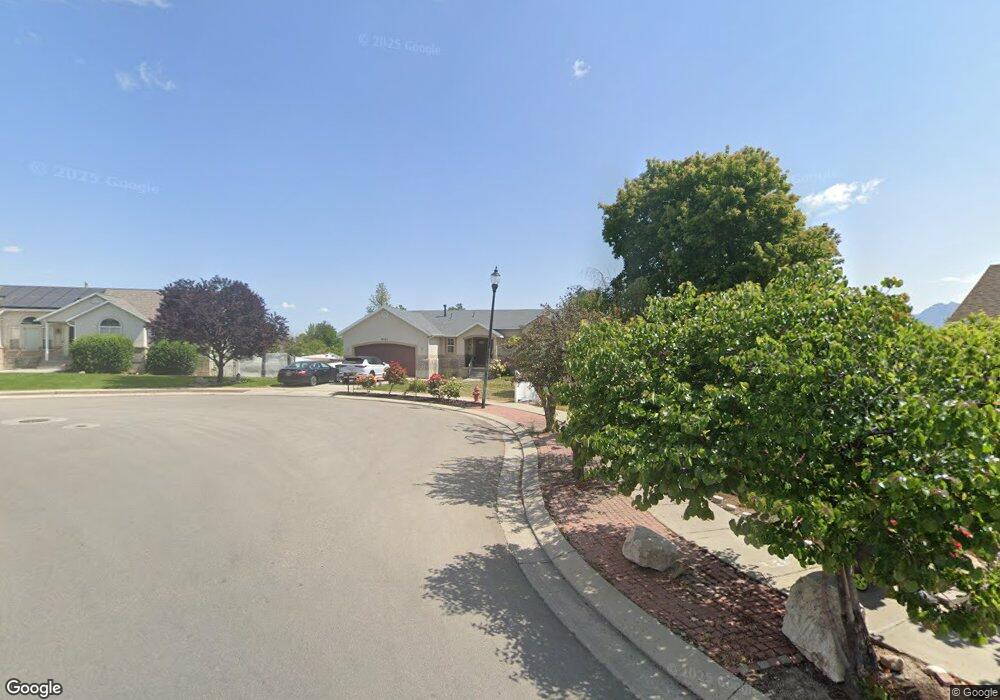
8067 S Mapleleaf Way West Jordan, UT 84088
Jordan Oaks NeighborhoodEstimated Value: $621,000 - $657,000
5
Beds
3
Baths
3,326
Sq Ft
$192/Sq Ft
Est. Value
About This Home
This home is located at 8067 S Mapleleaf Way, West Jordan, UT 84088 and is currently estimated at $637,853, approximately $191 per square foot. 8067 S Mapleleaf Way is a home located in Salt Lake County with nearby schools including Columbia Elementary School, Joel P. Jensen Middle School, and West Jordan High School.
Ownership History
Date
Name
Owned For
Owner Type
Purchase Details
Closed on
Apr 23, 2012
Sold by
Ruiz Rigoberto
Bought by
Ruiz Doreen
Current Estimated Value
Purchase Details
Closed on
Jan 22, 2007
Sold by
Ruiz Doreen M
Bought by
Ruiz Rigoberto and Ruiz Doreen
Home Financials for this Owner
Home Financials are based on the most recent Mortgage that was taken out on this home.
Original Mortgage
$195,250
Interest Rate
6.1%
Mortgage Type
New Conventional
Purchase Details
Closed on
Jun 14, 1999
Sold by
Pryor James L and Pryor Kim T
Bought by
Ruiz Doreen M
Home Financials for this Owner
Home Financials are based on the most recent Mortgage that was taken out on this home.
Original Mortgage
$146,200
Interest Rate
7.56%
Purchase Details
Closed on
Dec 30, 1996
Sold by
Craig & Company Custom Homes Llc
Bought by
Pryor James L and Pryor Kim T
Create a Home Valuation Report for This Property
The Home Valuation Report is an in-depth analysis detailing your home's value as well as a comparison with similar homes in the area
Home Values in the Area
Average Home Value in this Area
Purchase History
| Date | Buyer | Sale Price | Title Company |
|---|---|---|---|
| Ruiz Doreen | -- | None Available | |
| Ruiz Rigoberto | -- | Bonneville Superior Title | |
| Ruiz Doreen M | -- | Associated Title | |
| Pryor James L | -- | -- | |
| Pryor James L | -- | -- |
Source: Public Records
Mortgage History
| Date | Status | Borrower | Loan Amount |
|---|---|---|---|
| Previous Owner | Ruiz Rigoberto | $195,250 | |
| Previous Owner | Ruiz Doreen M | $146,200 |
Source: Public Records
Tax History Compared to Growth
Tax History
| Year | Tax Paid | Tax Assessment Tax Assessment Total Assessment is a certain percentage of the fair market value that is determined by local assessors to be the total taxable value of land and additions on the property. | Land | Improvement |
|---|---|---|---|---|
| 2025 | $3,076 | $613,000 | $148,900 | $464,100 |
| 2024 | $3,076 | $591,900 | $144,000 | $447,900 |
| 2023 | $3,076 | $540,100 | $135,900 | $404,200 |
| 2022 | $3,081 | $549,700 | $133,200 | $416,500 |
| 2021 | $2,588 | $420,200 | $99,900 | $320,300 |
| 2020 | $2,465 | $375,600 | $99,900 | $275,700 |
| 2019 | $2,481 | $370,800 | $99,900 | $270,900 |
| 2018 | $2,284 | $338,500 | $96,300 | $242,200 |
| 2017 | $2,143 | $316,300 | $96,300 | $220,000 |
| 2016 | $2,149 | $297,900 | $96,300 | $201,600 |
| 2015 | $2,033 | $274,800 | $98,200 | $176,600 |
| 2014 | $1,947 | $259,100 | $93,600 | $165,500 |
Source: Public Records
Map
Nearby Homes
- 7991 S 3725 W
- 7989 S 3725 W
- 3647 W 7865 S
- 3546 W 7980 S
- 3629 W 7825 S
- 3977 W Elwood Way
- 3476 W Spaulding Rd
- 8180 S Old Bingham Hwy
- 8058 S Lismore Ln Unit 304
- 3332 Lower Newark Way
- 8461 S Meadowlark Ln
- 3422 Briar Dr
- 3354 W 7800 S
- 8400 S 4000 W Unit 134
- 7611 S Springbrook Dr
- 3165 W 7720 S
- 3888 W 8700 S
- 3066 W Linton Dr
- 8493 S 3200 W
- 3112 Green Acre Dr
- 3764 Mapleleaf Way
- 3722 W 8070 S
- 8081 Mapleleaf Way
- 3721 W 8070 S
- 3731 W 8030 S
- 8036 S 3725 W
- 8115 S 3800 W
- 3778 Mapleleaf Way
- 8086 Mapleleaf Way
- 8101 Mapleleaf Way
- 3723 W 8030 S
- 3708 W 8070 S
- 3724 W 8110 S
- 8024 S 3725 W
- 3709 W 8070 S
- 8098 S Mapleleaf Way
- 8098 Mapleleaf Way
- 3715 W 8030 S
- 8114 S 3800 W
- 8105 S 3800 W