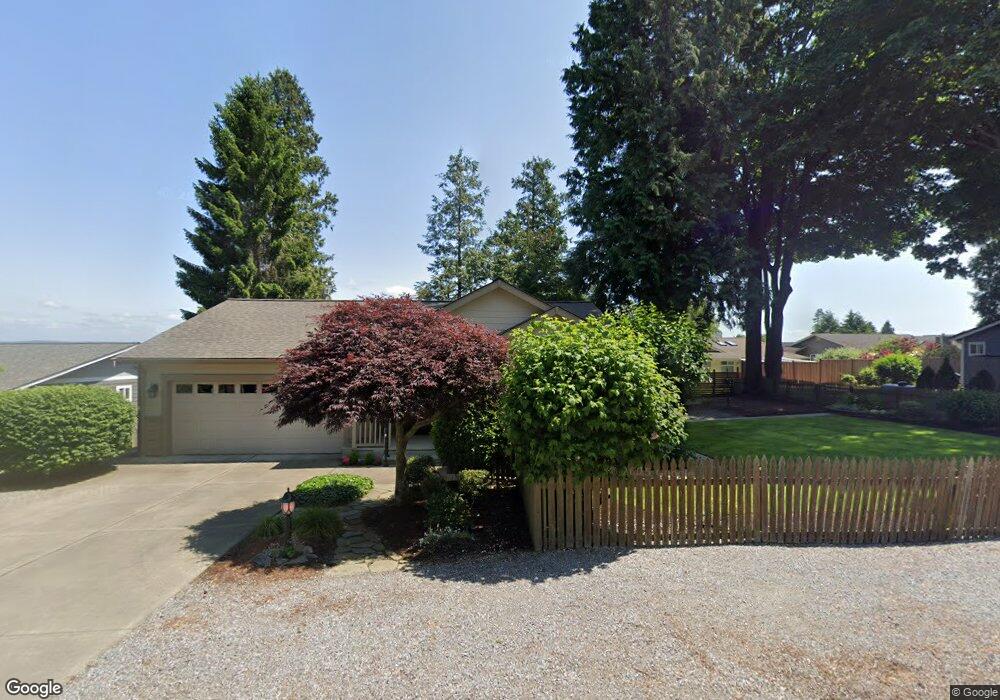
8068 Kayak Way Blaine, WA 98230
Estimated Value: $539,000 - $594,000
3
Beds
2
Baths
1,401
Sq Ft
$405/Sq Ft
Est. Value
About This Home
This home is located at 8068 Kayak Way, Blaine, WA 98230 and is currently estimated at $567,743, approximately $405 per square foot. 8068 Kayak Way is a home located in Whatcom County with nearby schools including Blaine Primary School, Blaine Elementary School, and Blaine Middle School.
Ownership History
Date
Name
Owned For
Owner Type
Purchase Details
Closed on
Feb 24, 2005
Sold by
Blake John A and Blake Diana J
Bought by
Wright Thomas W and Wright Janet E
Current Estimated Value
Home Financials for this Owner
Home Financials are based on the most recent Mortgage that was taken out on this home.
Original Mortgage
$184,000
Outstanding Balance
$93,592
Interest Rate
5.66%
Mortgage Type
Purchase Money Mortgage
Estimated Equity
$474,151
Purchase Details
Closed on
May 8, 2001
Sold by
Lewsader Construction Llc
Bought by
Blake John A and Blake Diana J
Home Financials for this Owner
Home Financials are based on the most recent Mortgage that was taken out on this home.
Original Mortgage
$158,100
Interest Rate
6.89%
Mortgage Type
VA
Purchase Details
Closed on
Sep 25, 2000
Sold by
Nakonechny Robert and Nakonechny Kay
Bought by
Lewsader Construction Llc
Create a Home Valuation Report for This Property
The Home Valuation Report is an in-depth analysis detailing your home's value as well as a comparison with similar homes in the area
Home Values in the Area
Average Home Value in this Area
Purchase History
| Date | Buyer | Sale Price | Title Company |
|---|---|---|---|
| Wright Thomas W | $230,000 | Chicago Title Insurance | |
| Blake John A | $133,230 | Charter Title Corporation | |
| Lewsader Construction Llc | -- | Charter Title Corporation |
Source: Public Records
Mortgage History
| Date | Status | Borrower | Loan Amount |
|---|---|---|---|
| Open | Wright Thomas W | $184,000 | |
| Previous Owner | Blake John A | $158,100 |
Source: Public Records
Tax History Compared to Growth
Tax History
| Year | Tax Paid | Tax Assessment Tax Assessment Total Assessment is a certain percentage of the fair market value that is determined by local assessors to be the total taxable value of land and additions on the property. | Land | Improvement |
|---|---|---|---|---|
| 2024 | $3,675 | $534,204 | $247,500 | $286,704 |
| 2023 | $3,675 | $534,204 | $247,500 | $286,704 |
| 2022 | $3,227 | $474,848 | $220,000 | $254,848 |
| 2021 | $3,071 | $356,731 | $138,856 | $217,875 |
| 2020 | $3,000 | $312,926 | $121,805 | $191,121 |
| 2019 | $2,735 | $294,517 | $114,640 | $179,877 |
| 2018 | $2,659 | $261,762 | $101,890 | $159,872 |
| 2017 | $2,274 | $229,508 | $89,335 | $140,173 |
| 2016 | $2,509 | $218,371 | $85,000 | $133,371 |
| 2015 | $2,459 | $232,706 | $100,370 | $132,336 |
| 2014 | -- | $222,692 | $96,050 | $126,642 |
| 2013 | -- | $220,262 | $95,000 | $125,262 |
Source: Public Records
Map
Nearby Homes
- 8061 Niska Rd
- 8903 Kitamat Way
- 8039 Niska Rd
- 8148 Quinault Rd
- 5727 Nakat Way
- 0 Skagit Way
- 8171 Quinault Rd
- 8059 Comox Rd
- 123 Skagit Way
- 0 Quinault Rd
- 8118 Comox Rd
- 8127 Lot 16 Comox Rd
- 8155 Comox Loop
- 5685 Nakat Way
- 8104 Chehalis Rd
- 8142 Comox Rd
- 8165 Comox Rd
- 8018 Comox Rd
- 5611 Matsqui Place
- 5575 Coquitlam Dr
- 8076 Kayak Way
- 8062 Kayak Way
- 8073 Kispiox Rd
- 8071 Kayak Way
- 8067 Kispiox Rd
- 8079 Kispiox Rd
- 8065 Kayak Way
- 8079 Kayak Way
- 8080 Kayak Way
- 8059 Kayak Way
- 8056 Kayak Way
- 8061 Kispiox Rd
- 8083 Kispiox Rd
- 8085 Kispiox Rd
- 103 Kispiox Rd
- 0 Kispiox Rd
- 74 Kispiox Rd
- 8072 Kitamat Way
- 8085 Kayak Way
- 8066 Kitamat Way