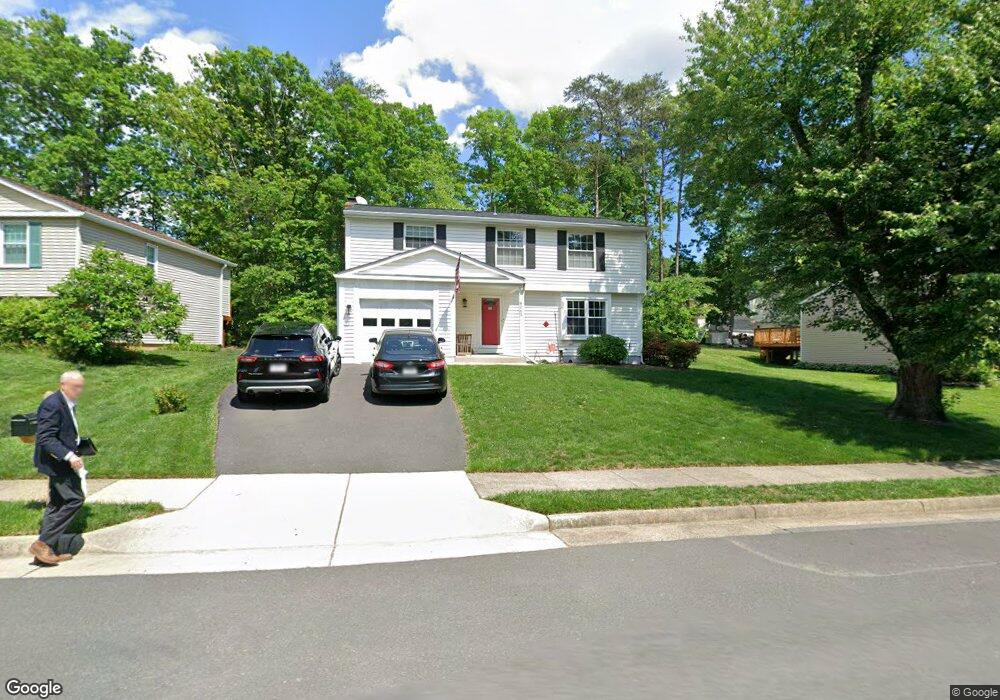
8069 Winding Way Ct Springfield, VA 22153
Estimated Value: $728,000 - $771,696
4
Beds
4
Baths
1,756
Sq Ft
$430/Sq Ft
Est. Value
About This Home
This home is located at 8069 Winding Way Ct, Springfield, VA 22153 and is currently estimated at $754,674, approximately $429 per square foot. 8069 Winding Way Ct is a home located in Fairfax County with nearby schools including Newington Forest Elementary School, South County Middle School, and South County High School.
Ownership History
Date
Name
Owned For
Owner Type
Purchase Details
Closed on
Dec 30, 2021
Sold by
Ira Thomas Yow and Ira Suzan Featherston
Bought by
Yow Ira Thomas and Yow Susan F
Current Estimated Value
Home Financials for this Owner
Home Financials are based on the most recent Mortgage that was taken out on this home.
Original Mortgage
$132,933
Interest Rate
2.63%
Mortgage Type
New Conventional
Purchase Details
Closed on
Apr 28, 2021
Sold by
Thomas Yow Jr Ira and Featherston Suzan
Bought by
Ira Thomas Yow Jr And Suzan Featherston Yow T and Yow
Purchase Details
Closed on
May 14, 1985
Bought by
Yow Ira Thomas and And Suzon F
Create a Home Valuation Report for This Property
The Home Valuation Report is an in-depth analysis detailing your home's value as well as a comparison with similar homes in the area
Home Values in the Area
Average Home Value in this Area
Purchase History
| Date | Buyer | Sale Price | Title Company |
|---|---|---|---|
| Yow Ira Thomas | -- | None Listed On Document | |
| Ira Thomas Yow Jr And Suzan Featherston Yow T | -- | Amrock Llc | |
| Yow Ira Thomas | -- | None Listed On Document | |
| Ira Thomas Yow Jr And Suzan Featherston Yow T | -- | None Listed On Document | |
| Yow Ira Thomas | -- | None Available | |
| Yow Ira Thomas | $119,000 | -- |
Source: Public Records
Mortgage History
| Date | Status | Borrower | Loan Amount |
|---|---|---|---|
| Previous Owner | Yow Ira Thomas | $132,933 |
Source: Public Records
Tax History Compared to Growth
Tax History
| Year | Tax Paid | Tax Assessment Tax Assessment Total Assessment is a certain percentage of the fair market value that is determined by local assessors to be the total taxable value of land and additions on the property. | Land | Improvement |
|---|---|---|---|---|
| 2025 | $7,597 | $703,580 | $285,000 | $418,580 |
| 2024 | $7,597 | $655,790 | $265,000 | $390,790 |
| 2023 | $7,095 | $628,700 | $250,000 | $378,700 |
| 2022 | $6,822 | $596,620 | $230,000 | $366,620 |
| 2021 | $6,191 | $527,580 | $200,000 | $327,580 |
| 2020 | $5,906 | $498,990 | $185,000 | $313,990 |
| 2019 | $5,738 | $484,840 | $180,000 | $304,840 |
| 2018 | $5,384 | $468,130 | $175,000 | $293,130 |
| 2017 | $5,158 | $444,230 | $165,000 | $279,230 |
| 2016 | $5,146 | $444,230 | $165,000 | $279,230 |
| 2015 | $4,790 | $429,230 | $165,000 | $264,230 |
| 2014 | $4,565 | $410,000 | $155,000 | $255,000 |
Source: Public Records
Map
Nearby Homes
- 8580 Tyrolean Way
- 8740 Cold Plain Ct
- 7808 Tower Woods Dr
- 8110 Winter Blue Ct
- 8375 Magic Leaf Rd
- 8011 Treasure Tree Ct
- 7757 Tara Heights Place
- 8312 Timber Brook Ln
- 7676 Green Garland Dr
- 7729 Middle Valley Dr
- 7743 Middle Valley Dr
- 8757 Southern Oaks Place
- 8761 Southern Oaks Place
- The Grant Plan at Southern Oaks Reserve
- The Taylor Plan at Southern Oaks Reserve
- 8420 Sweet Pine Ct
- 8542 Blue Rock Ln
- 8278 Crestmont Cir
- 8431 Ambrose Ct
- 8504 Blue Rock Ln
- 8067 Winding Way Ct
- 8071 Winding Way Ct
- 8060 Athena St
- 8058 Athena St
- 8063 Winding Way Ct
- 8073 Winding Way Ct
- 8062 Athena St
- 8056 Athena St
- 8068 Winding Way Ct
- 8066 Winding Way Ct
- 8070 Winding Way Ct
- 8064 Athena St
- 8059 Winding Way Ct
- 8075 Winding Way Ct
- 8054 Athena St
- 8072 Winding Way Ct
- 8064 Winding Way Ct
- 8066 Athena St
- 8061 Athena St
- 8074 Winding Way Ct