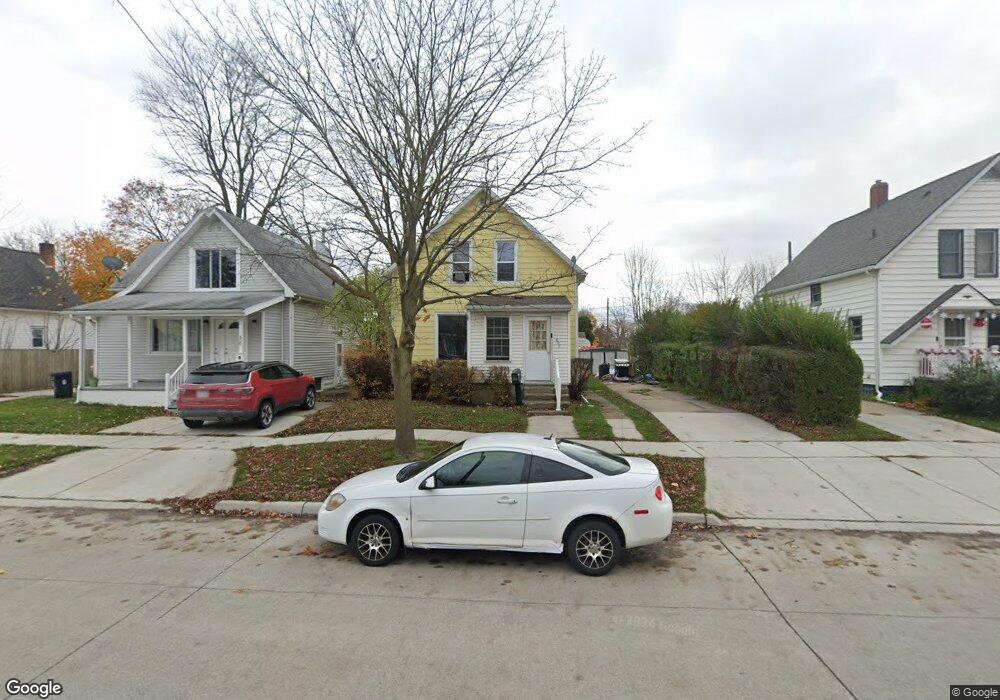
807 16th St Port Huron, MI 48060
Estimated Value: $117,000 - $147,000
3
Beds
2
Baths
1,078
Sq Ft
$123/Sq Ft
Est. Value
About This Home
This home is located at 807 16th St, Port Huron, MI 48060 and is currently estimated at $132,404, approximately $122 per square foot. 807 16th St is a home located in St. Clair County with nearby schools including Michigamme Elementary School, Central Middle School, and Port Huron High School.
Ownership History
Date
Name
Owned For
Owner Type
Purchase Details
Closed on
Nov 13, 2024
Sold by
Weideman Yvonne
Bought by
Invest One Llc
Current Estimated Value
Purchase Details
Closed on
Sep 23, 2024
Sold by
Michigan Foreclosure Solutions Llc
Bought by
Invest One Llc
Purchase Details
Closed on
Apr 26, 2024
Sold by
Weideman Yvonne
Bought by
Sw Michigan Asset Mgmt Llc
Purchase Details
Closed on
Apr 25, 2024
Sold by
Deputy Sheriff In & /Saint Clai
Bought by
Michigan Foreclosure Sol Llc
Create a Home Valuation Report for This Property
The Home Valuation Report is an in-depth analysis detailing your home's value as well as a comparison with similar homes in the area
Home Values in the Area
Average Home Value in this Area
Purchase History
| Date | Buyer | Sale Price | Title Company |
|---|---|---|---|
| Invest One Llc | -- | None Listed On Document | |
| Invest One Llc | -- | None Listed On Document | |
| Invest One Llc | -- | None Listed On Document | |
| Invest One Llc | -- | None Listed On Document | |
| Sw Michigan Asset Mgmt Llc | -- | None Listed On Document | |
| Michigan Foreclosure Sol Llc | $62,000 | None Listed On Document |
Source: Public Records
Tax History
| Year | Tax Paid | Tax Assessment Tax Assessment Total Assessment is a certain percentage of the fair market value that is determined by local assessors to be the total taxable value of land and additions on the property. | Land | Improvement |
|---|---|---|---|---|
| 2025 | $3,095 | $50,500 | $0 | $0 |
| 2024 | $1,499 | $49,100 | $0 | $0 |
| 2023 | $1,427 | $44,800 | $0 | $0 |
| 2022 | $1,390 | $39,300 | $0 | $0 |
| 2020 | $1,287 | $32,600 | $32,600 | $0 |
| 2019 | $1,271 | $23,100 | $0 | $0 |
| 2018 | $1,178 | $23,100 | $0 | $0 |
| 2017 | $1,082 | $20,200 | $0 | $0 |
| 2016 | $955 | $20,200 | $0 | $0 |
| 2015 | $984 | $18,400 | $18,400 | $0 |
| 2014 | $984 | $17,400 | $17,400 | $0 |
| 2013 | -- | $18,700 | $0 | $0 |
Source: Public Records
Map
Nearby Homes