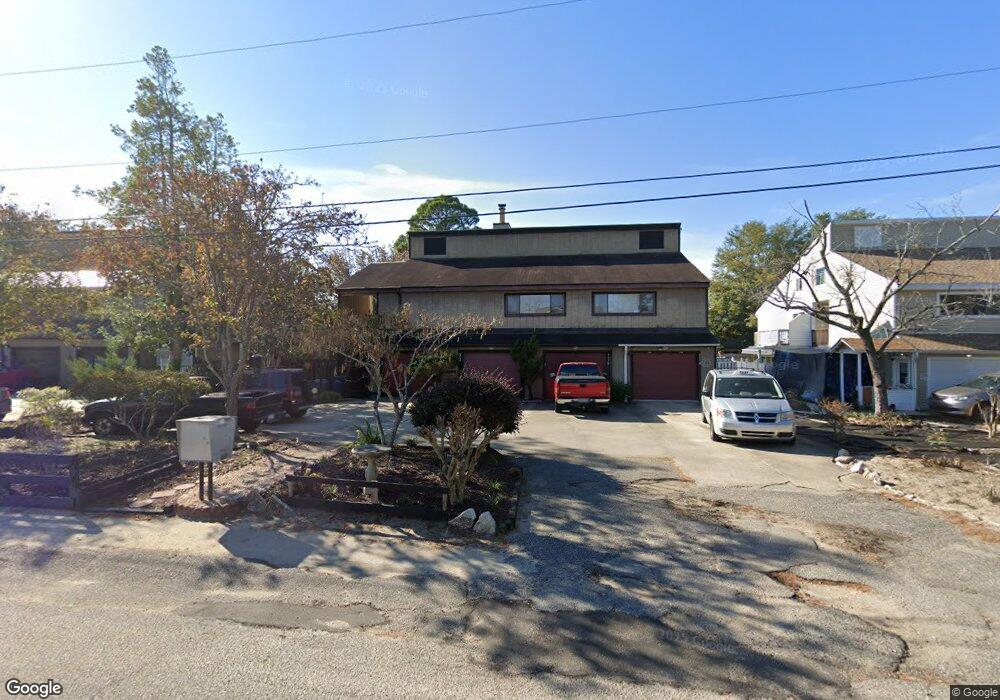
807 66th Ave N Unit C Academy Acres Myrtle Beach, SC 29572
Grande Dunes NeighborhoodEstimated Value: $184,000 - $293,000
3
Beds
2
Baths
1,653
Sq Ft
$148/Sq Ft
Est. Value
About This Home
This home is located at 807 66th Ave N Unit C Academy Acres, Myrtle Beach, SC 29572 and is currently estimated at $244,490, approximately $147 per square foot. 807 66th Ave N Unit C Academy Acres is a home located in Horry County with nearby schools including Myrtle Beach Child Development Center, Myrtle Beach Elementary School, and Myrtle Beach Primary School.
Ownership History
Date
Name
Owned For
Owner Type
Purchase Details
Closed on
Aug 18, 2022
Sold by
Michalska Dobroslawa
Bought by
Shkullaku Endiola and Shkullaku Enver
Current Estimated Value
Home Financials for this Owner
Home Financials are based on the most recent Mortgage that was taken out on this home.
Original Mortgage
$140,000
Outstanding Balance
$133,879
Interest Rate
5.54%
Mortgage Type
New Conventional
Estimated Equity
$110,611
Purchase Details
Closed on
Oct 26, 2011
Sold by
First Federal Savings And Loan Associati
Bought by
Michalska Dobroslawa
Purchase Details
Closed on
Feb 17, 2011
Sold by
Master In Equity Horry County
Bought by
First Federal Savings & Loan Association
Purchase Details
Closed on
May 18, 2005
Sold by
Bushong George D
Bought by
Franklin Credit Management Corp
Purchase Details
Closed on
Jan 28, 2000
Sold by
Roschy Shirley O
Bought by
Bushong George D
Create a Home Valuation Report for This Property
The Home Valuation Report is an in-depth analysis detailing your home's value as well as a comparison with similar homes in the area
Home Values in the Area
Average Home Value in this Area
Purchase History
| Date | Buyer | Sale Price | Title Company |
|---|---|---|---|
| Shkullaku Endiola | $230,000 | -- | |
| Michalska Dobroslawa | $20,800 | -- | |
| First Federal Savings & Loan Association | $67,950 | -- | |
| Franklin Credit Management Corp | $96,006 | -- | |
| Bushong George D | $75,493 | -- |
Source: Public Records
Mortgage History
| Date | Status | Borrower | Loan Amount |
|---|---|---|---|
| Open | Shkullaku Endiola | $140,000 |
Source: Public Records
Tax History Compared to Growth
Tax History
| Year | Tax Paid | Tax Assessment Tax Assessment Total Assessment is a certain percentage of the fair market value that is determined by local assessors to be the total taxable value of land and additions on the property. | Land | Improvement |
|---|---|---|---|---|
| 2024 | $737 | $9,261 | $3,000 | $6,261 |
| 2023 | $737 | $4,755 | $718 | $4,037 |
| 2021 | $1,283 | $5,652 | $1,314 | $4,338 |
| 2020 | $1,408 | $5,652 | $1,314 | $4,338 |
| 2019 | $1,224 | $5,652 | $1,314 | $4,338 |
| 2018 | $1,099 | $4,134 | $624 | $3,510 |
| 2017 | $1,086 | $4,134 | $624 | $3,510 |
| 2016 | -- | $4,134 | $624 | $3,510 |
| 2015 | $1,074 | $4,134 | $624 | $3,510 |
| 2014 | $1,044 | $4,134 | $624 | $3,510 |
Source: Public Records
Map
Nearby Homes
- 843 67th Ave N
- 6619 Colonial Dr
- 712 67th Ave N Unit 2A
- 712 67th Ave N Unit 1E
- 6703 Jefferson Place Unit B1
- 6703 Jefferson Place Unit B-2
- 6215 Blynn Dr Unit A
- 6702 Jefferson Place Unit F2
- 6702 Jefferson Place Unit C3
- 6702 Jefferson Place Unit B6
- 6702 Jefferson Place Unit C6
- TBD Bryant St. Bryant St Unit BRYANT DR; PARCEL 2-
- 6210 Blynn Dr
- 6774 Montgomery Ln
- 6706 Bryant St Unit C
- 6703 Bryant St Unit A
- 6703 Bryant St
- 6708 Bryant St Unit E
- TBD 67th Ave N
- 6570 Torino Ln
- 807 66th Ave N Unit Academy Acres B
- 807 66th Ave N
- 807 66th Ave N Unit D
- 807 66th Ave N Unit C
- 807 66th Ave N Unit B
- 807 66th Ave N Unit A
- 807 66th Ave N Unit 1
- 809 66th Ave N
- 809 66th Ave N Unit C
- 809 66th Ave N Unit B
- 809 66th Ave N Unit A
- 805 66th Ave N Unit A
- 805 66th Ave N
- 805 66th Ave N Unit D
- 805 66th Ave N Unit C
- 805 66th Ave N Unit B
- 805 66th Ave N Unit I
- 803 66th Ave N Unit COLONIAL TOWNHOMES
- 803 66th Ave N
- 803 66th Ave N Unit 11