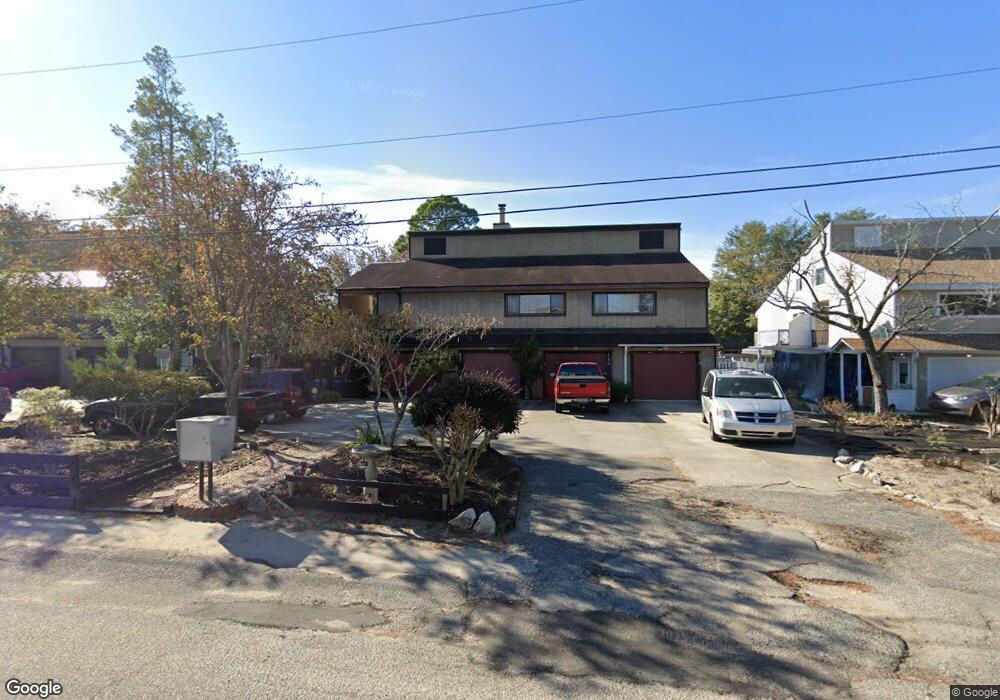
807 66th Ave N Unit D Myrtle Beach, SC 29572
Grande Dunes NeighborhoodEstimated Value: $149,000 - $163,699
2
Beds
1
Bath
914
Sq Ft
$169/Sq Ft
Est. Value
About This Home
This home is located at 807 66th Ave N Unit D, Myrtle Beach, SC 29572 and is currently estimated at $154,675, approximately $169 per square foot. 807 66th Ave N Unit D is a home located in Horry County with nearby schools including Myrtle Beach Child Development Center, Myrtle Beach Elementary School, and Myrtle Beach Primary School.
Ownership History
Date
Name
Owned For
Owner Type
Purchase Details
Closed on
May 23, 2019
Sold by
Crystal Real Estate Llc
Bought by
Wernig Jeremy L and Wernig Kate D
Current Estimated Value
Purchase Details
Closed on
Jun 25, 2018
Sold by
Crystal Real Estate Llc Ea
Bought by
Wernig Jeremy Lee and Rubright Donovan Kate
Home Financials for this Owner
Home Financials are based on the most recent Mortgage that was taken out on this home.
Original Mortgage
$78,850
Interest Rate
4.6%
Mortgage Type
New Conventional
Purchase Details
Closed on
Jun 27, 2016
Sold by
Moolah Corp
Bought by
Crystal Real Estate Llc
Purchase Details
Closed on
Sep 24, 2011
Sold by
Sowards Thomas A
Bought by
Moolah Corporation
Purchase Details
Closed on
Jul 20, 2009
Sold by
Moolah Corporation
Bought by
Sowards Thomas A
Purchase Details
Closed on
Jan 7, 2009
Sold by
Alfonsi Thomas J
Bought by
Moolah Corporation
Purchase Details
Closed on
Jul 18, 2002
Sold by
The Moolah Corp
Bought by
Alfonsi Thomas J
Purchase Details
Closed on
Jun 3, 2002
Sold by
Lillian Ellison Mary
Bought by
The Moolah Corp
Create a Home Valuation Report for This Property
The Home Valuation Report is an in-depth analysis detailing your home's value as well as a comparison with similar homes in the area
Home Values in the Area
Average Home Value in this Area
Purchase History
| Date | Buyer | Sale Price | Title Company |
|---|---|---|---|
| Wernig Jeremy L | -- | -- | |
| Wernig Jeremy Lee | $83,000 | -- | |
| Crystal Real Estate Llc | $25,000 | -- | |
| Moolah Corporation | -- | -- | |
| Sowards Thomas A | $75,159 | -- | |
| Moolah Corporation | $75,159 | -- | |
| Alfonsi Thomas J | $82,500 | -- | |
| The Moolah Corp | -- | -- |
Source: Public Records
Mortgage History
| Date | Status | Borrower | Loan Amount |
|---|---|---|---|
| Previous Owner | Wernig Jeremy Lee | $78,850 |
Source: Public Records
Tax History Compared to Growth
Tax History
| Year | Tax Paid | Tax Assessment Tax Assessment Total Assessment is a certain percentage of the fair market value that is determined by local assessors to be the total taxable value of land and additions on the property. | Land | Improvement |
|---|---|---|---|---|
| 2024 | $295 | $6,341 | $3,000 | $3,341 |
| 2023 | $295 | $2,880 | $876 | $2,004 |
| 2021 | $265 | $6,137 | $876 | $5,261 |
| 2020 | $229 | $6,137 | $876 | $5,261 |
| 2019 | $221 | $6,137 | $876 | $5,261 |
| 2018 | $168 | $4,910 | $416 | $4,494 |
| 2017 | $839 | $3,192 | $624 | $2,568 |
| 2016 | -- | $3,192 | $624 | $2,568 |
| 2015 | $829 | $3,192 | $624 | $2,568 |
| 2014 | $806 | $3,192 | $624 | $2,568 |
Source: Public Records
Map
Nearby Homes
- 843 67th Ave N
- 6619 Colonial Dr
- 712 67th Ave N Unit 2A
- 712 67th Ave N Unit 1E
- 6703 Jefferson Place Unit B1
- 6703 Jefferson Place Unit B-2
- 6215 Blynn Dr Unit A
- 6702 Jefferson Place Unit F2
- 6702 Jefferson Place Unit C3
- 6702 Jefferson Place Unit B6
- 6702 Jefferson Place Unit C6
- TBD Bryant St. Bryant St Unit BRYANT DR; PARCEL 2-
- 6210 Blynn Dr
- 6774 Montgomery Ln
- 6706 Bryant St Unit C
- 6703 Bryant St Unit A
- 6703 Bryant St
- 6708 Bryant St Unit E
- TBD 67th Ave N
- 6570 Torino Ln
- 807 66th Ave N Unit C Academy Acres
- 807 66th Ave N Unit Academy Acres B
- 807 66th Ave N
- 807 66th Ave N Unit C
- 807 66th Ave N Unit B
- 807 66th Ave N Unit A
- 807 66th Ave N Unit 1
- 809 66th Ave N
- 809 66th Ave N Unit C
- 809 66th Ave N Unit B
- 809 66th Ave N Unit A
- 805 66th Ave N Unit A
- 805 66th Ave N
- 805 66th Ave N Unit D
- 805 66th Ave N Unit C
- 805 66th Ave N Unit B
- 805 66th Ave N Unit I
- 803 66th Ave N Unit COLONIAL TOWNHOMES
- 803 66th Ave N
- 803 66th Ave N Unit 11