Estimated Value: $429,000 - $479,000
3
Beds
2
Baths
2,332
Sq Ft
$192/Sq Ft
Est. Value
About This Home
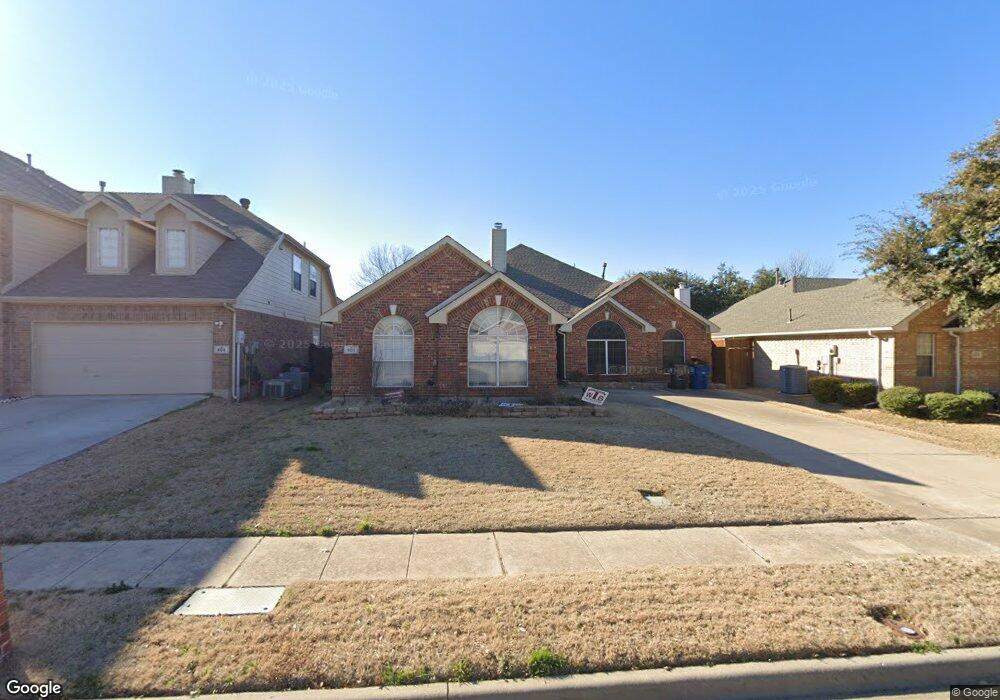
This home is located at 807 Bayou Ct, Wylie, TX 75098 and is currently estimated at $448,164, approximately $192 per square foot. 807 Bayou Ct is a home located in Collin County with nearby schools including R V Groves Elementary School, Dr. Al Draper Intermediate Middle School, and Raymond B Cooper J High School.
Ownership History
Date
Name
Owned For
Owner Type
Purchase Details
Closed on
Jul 27, 2017
Sold by
Winger Mark L and Winger Maria
Bought by
Lessa Kathy D
Current Estimated Value
Home Financials for this Owner
Home Financials are based on the most recent Mortgage that was taken out on this home.
Original Mortgage
$220,000
Outstanding Balance
$183,325
Interest Rate
3.91%
Mortgage Type
New Conventional
Estimated Equity
$264,839
Purchase Details
Closed on
Nov 29, 2000
Sold by
Mhi Partnership Ltd
Bought by
Winger Mark L
Home Financials for this Owner
Home Financials are based on the most recent Mortgage that was taken out on this home.
Original Mortgage
$120,000
Interest Rate
7.8%
Purchase Details
Closed on
May 5, 2000
Sold by
Ashton Custer Llc
Bought by
Mhi Partnership Ltd
Create a Home Valuation Report for This Property
The Home Valuation Report is an in-depth analysis detailing your home's value as well as a comparison with similar homes in the area
Home Values in the Area
Average Home Value in this Area
Purchase History
| Date | Buyer | Sale Price | Title Company |
|---|---|---|---|
| Lessa Kathy D | -- | Chicago Title | |
| Winger Mark L | -- | -- | |
| Mhi Partnership Ltd | -- | -- |
Source: Public Records
Mortgage History
| Date | Status | Borrower | Loan Amount |
|---|---|---|---|
| Open | Lessa Kathy D | $220,000 | |
| Previous Owner | Winger Mark L | $120,000 |
Source: Public Records
Tax History Compared to Growth
Tax History
| Year | Tax Paid | Tax Assessment Tax Assessment Total Assessment is a certain percentage of the fair market value that is determined by local assessors to be the total taxable value of land and additions on the property. | Land | Improvement |
|---|---|---|---|---|
| 2025 | $6,475 | $433,644 | $125,000 | $312,820 |
| 2024 | $6,475 | $394,222 | $125,000 | $298,748 |
| 2023 | $6,475 | $358,384 | $110,000 | $324,000 |
| 2022 | $7,148 | $325,804 | $90,000 | $284,292 |
| 2021 | $6,969 | $296,909 | $70,000 | $226,909 |
| 2020 | $6,686 | $269,259 | $65,000 | $204,259 |
| 2019 | $7,048 | $268,188 | $65,000 | $203,188 |
| 2018 | $6,992 | $259,636 | $65,000 | $194,636 |
| 2017 | $6,533 | $249,107 | $60,000 | $189,107 |
| 2016 | $6,127 | $225,809 | $50,000 | $175,809 |
| 2015 | $4,901 | $202,280 | $45,000 | $157,280 |
Source: Public Records
Map
Nearby Homes
- 802 Appalachian Dr
- 3119 Connor Ln
- 517 Royal Oak Dr
- 563 John Ross Rd
- 620 Fall Wheat Dr
- 801 Hunters Glen
- 728 Morningside Trail
- 413 Royal Oak Dr
- 3014 Eastwood Dr
- 1205 Periwinkle Dr
- 3105 Admiral Dr
- 2912 Katie Cir
- 310 Admiral Dr
- 3111 Candlebrook Dr
- 307 Wooded Creek Ave
- 607 Hilltop Dr
- 2907 Abby Ln
- 3003 Candlebrook Dr
- 404 Crepe Myrtle Ln
- 3017 Eagle Mountain Dr
- 809 Bayou Ct
- 805 Bayou Ct
- 806 Glen Lakes Ct
- 901 Bayou Ct
- 803 Bayou Ct
- 808 Glen Lakes Ct
- 804 Glen Lakes Ct
- 900 Glen Lakes Ct
- 806 Bayou Ct
- 802 Glen Lakes Ct
- 804 Bayou Ct
- 903 Bayou Ct
- 802 Bayou Ct
- 902 Glen Lakes Ct
- 905 Bayou Ct
- 904 Glen Lakes Ct
- 3502 Brookside Dr
- 3500 Brookside Dr
- 807 Glen Lakes Ct
- 809 Glen Lakes Ct