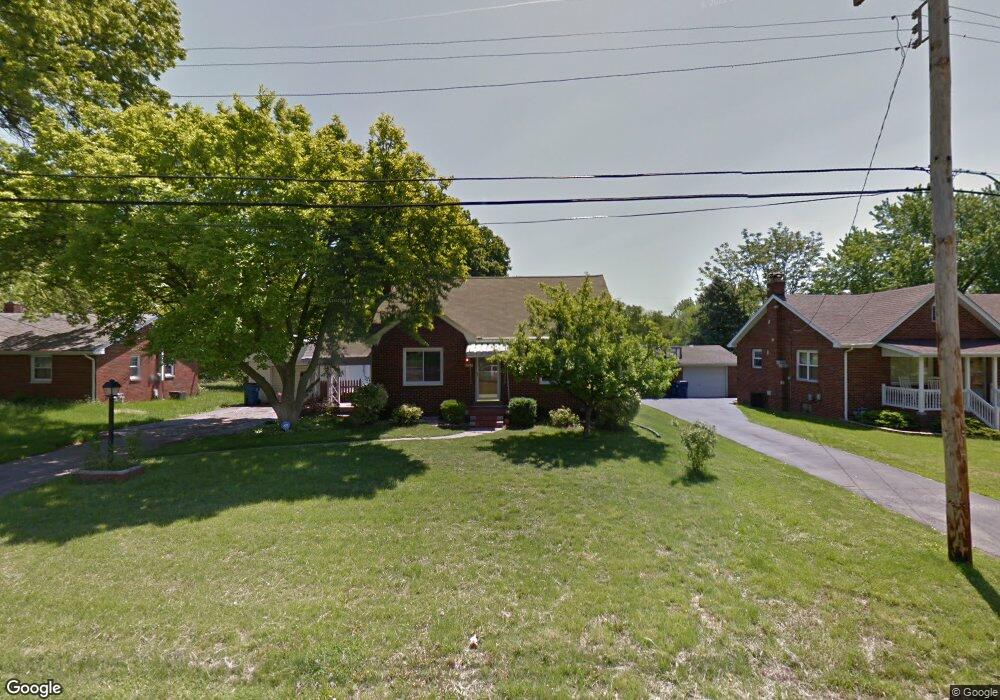
807 Birch Dr Collinsville, IL 62234
Estimated Value: $176,925 - $193,000
3
Beds
2
Baths
1,350
Sq Ft
$135/Sq Ft
Est. Value
About This Home
This home is located at 807 Birch Dr, Collinsville, IL 62234 and is currently estimated at $182,481, approximately $135 per square foot. 807 Birch Dr is a home located in St. Clair County with nearby schools including Twin Echo Elementary School, Dorris Intermediate School, and Collinsville Middle School.
Ownership History
Date
Name
Owned For
Owner Type
Purchase Details
Closed on
Dec 30, 2011
Sold by
Houston Eric C and Orourke Kelly N
Bought by
Orourke Robert E and Declaration Trust Of Robert E Orourke
Current Estimated Value
Purchase Details
Closed on
Jul 31, 2008
Sold by
Chance Steven M and Chance Suzanne
Bought by
Houston Eric C and Orourke Kelly N
Home Financials for this Owner
Home Financials are based on the most recent Mortgage that was taken out on this home.
Original Mortgage
$105,300
Interest Rate
6.5%
Mortgage Type
Purchase Money Mortgage
Purchase Details
Closed on
Jun 14, 2001
Sold by
Wyatt Donald and Wyatt Barbara
Bought by
Chance Steven M and Chance Suzanne
Home Financials for this Owner
Home Financials are based on the most recent Mortgage that was taken out on this home.
Original Mortgage
$59,700
Interest Rate
7.11%
Mortgage Type
Balloon
Create a Home Valuation Report for This Property
The Home Valuation Report is an in-depth analysis detailing your home's value as well as a comparison with similar homes in the area
Home Values in the Area
Average Home Value in this Area
Purchase History
| Date | Buyer | Sale Price | Title Company |
|---|---|---|---|
| Orourke Robert E | $102,000 | Madco Title | |
| Houston Eric C | $117,000 | Madco Title | |
| Chance Steven M | -- | Nations Title Agency Inc |
Source: Public Records
Mortgage History
| Date | Status | Borrower | Loan Amount |
|---|---|---|---|
| Previous Owner | Houston Eric C | $105,300 | |
| Previous Owner | Chance Steven M | $59,700 |
Source: Public Records
Tax History Compared to Growth
Tax History
| Year | Tax Paid | Tax Assessment Tax Assessment Total Assessment is a certain percentage of the fair market value that is determined by local assessors to be the total taxable value of land and additions on the property. | Land | Improvement |
|---|---|---|---|---|
| 2024 | $3,352 | $50,053 | $5,380 | $44,673 |
| 2023 | $3,095 | $44,287 | $4,760 | $39,527 |
| 2022 | $2,781 | $39,979 | $4,665 | $35,314 |
| 2021 | $2,737 | $37,945 | $4,428 | $33,517 |
| 2020 | $2,692 | $35,943 | $4,194 | $31,749 |
| 2019 | $2,629 | $35,943 | $4,194 | $31,749 |
| 2018 | $2,584 | $35,150 | $4,484 | $30,666 |
| 2017 | $2,611 | $33,724 | $4,302 | $29,422 |
| 2016 | $2,658 | $32,963 | $4,205 | $28,758 |
| 2014 | $1,898 | $25,230 | $2,738 | $22,492 |
| 2013 | $1,556 | $25,695 | $2,788 | $22,907 |
Source: Public Records
Map
Nearby Homes
- 625 Greenwood Place
- 9 Grandview Dr
- 101 Osage Dr
- 717 Greenwood Place
- 408 Hillside Dr
- 11 Davis Place
- 151 Helen Place
- 202 Keeneland Ct
- 89 Fox Run Rd
- 208 Coral Dr
- 710 Saint Louis Rd
- 116 Moffett Ave
- 804 Carl St
- 114 Moffett Ave Unit 116
- 1109 Saint Clair Ave
- 128 Courtland Place
- 8085 Villa Valley Ln
- Lot 20 Jefferson Ave
- Lot 36 Jefferson Ave
- Lot 38 Jefferson Ave