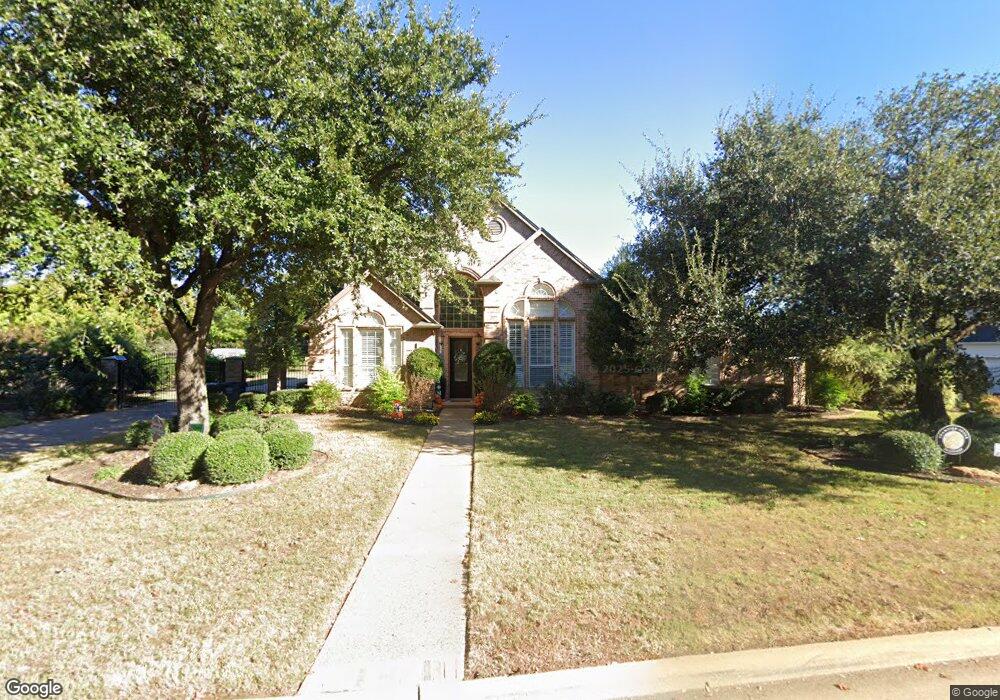
807 Boston Dr Southlake, TX 76092
Estimated Value: $1,294,000 - $1,319,000
5
Beds
4
Baths
3,550
Sq Ft
$367/Sq Ft
Est. Value
About This Home
This home is located at 807 Boston Dr, Southlake, TX 76092 and is currently estimated at $1,303,942, approximately $367 per square foot. 807 Boston Dr is a home located in Tarrant County with nearby schools including Robert High Rockenbaugh Elementary School, Eubanks Intermediate School, and George Dawson Middle School.
Ownership History
Date
Name
Owned For
Owner Type
Purchase Details
Closed on
Jun 30, 2014
Sold by
Farley James Edward and Farley Kathleen Lynn
Bought by
Farley Kathleen Lynn and Farley Living Trust
Current Estimated Value
Purchase Details
Closed on
Sep 10, 1997
Sold by
Patrick Custom Homes Inc
Bought by
Farley James E and Farley Kathleen L
Home Financials for this Owner
Home Financials are based on the most recent Mortgage that was taken out on this home.
Original Mortgage
$130,000
Outstanding Balance
$20,164
Interest Rate
7.48%
Estimated Equity
$1,283,778
Purchase Details
Closed on
Apr 28, 1997
Sold by
Sunnybrook Properties Inc
Bought by
Patrick Custom Homes Inc
Home Financials for this Owner
Home Financials are based on the most recent Mortgage that was taken out on this home.
Original Mortgage
$260,000
Interest Rate
7.92%
Create a Home Valuation Report for This Property
The Home Valuation Report is an in-depth analysis detailing your home's value as well as a comparison with similar homes in the area
Home Values in the Area
Average Home Value in this Area
Purchase History
| Date | Buyer | Sale Price | Title Company |
|---|---|---|---|
| Farley Kathleen Lynn | -- | None Available | |
| Farley James E | -- | Commonwealth Land Title | |
| Patrick Custom Homes Inc | -- | Rattikin Title Co |
Source: Public Records
Mortgage History
| Date | Status | Borrower | Loan Amount |
|---|---|---|---|
| Open | Farley James E | $130,000 | |
| Previous Owner | Patrick Custom Homes Inc | $260,000 |
Source: Public Records
Tax History Compared to Growth
Tax History
| Year | Tax Paid | Tax Assessment Tax Assessment Total Assessment is a certain percentage of the fair market value that is determined by local assessors to be the total taxable value of land and additions on the property. | Land | Improvement |
|---|---|---|---|---|
| 2025 | $15,450 | $1,159,968 | $366,675 | $793,293 |
| 2024 | $15,450 | $1,159,968 | $366,675 | $793,293 |
| 2023 | $16,860 | $994,606 | $366,675 | $627,931 |
| 2022 | $18,142 | $943,680 | $244,450 | $699,230 |
| 2021 | $17,430 | $770,025 | $244,450 | $525,575 |
| 2020 | $15,975 | $694,984 | $220,005 | $474,979 |
| 2019 | $16,781 | $692,984 | $150,000 | $542,984 |
| 2018 | $15,774 | $691,176 | $150,000 | $541,176 |
| 2017 | $16,700 | $676,547 | $150,000 | $526,547 |
| 2016 | $15,182 | $645,272 | $150,000 | $495,272 |
| 2015 | $12,228 | $587,424 | $65,000 | $522,424 |
| 2014 | $12,228 | $506,200 | $65,000 | $441,200 |
Source: Public Records
Map
Nearby Homes
- 802 Princeton Ct
- 305 Canyon Lake Dr
- 800 Woodcrest Ct
- 351 S White Chapel Blvd
- 221 Pine Dr
- 806 Shadow Glen Dr
- 900 Kingsbury Way
- 205 Edinburgh Ct
- 806 Ridgedale Ct
- 608 Stratford Dr
- 1196 W Continental Blvd
- 1227 Strathmore Dr
- 712 Ashleigh Ln
- 102 Springbrook Ct
- 708 Nettleton Dr
- 710 Longford Dr
- 305 Sheffield Dr
- 7607 Monticello Pkwy
- 300 Shady Oaks Dr
- 7312 Hix Ct
- 809 Boston Dr
- 805 Boston Dr
- 808 Boston Dr
- 102 Parkcrest Dr
- 806 Boston Dr
- 811 Boston Dr
- 804 Boston Dr
- 803 Boston Dr
- 104 Parkcrest Dr
- 802 Boston Dr
- 101 Parkcrest Dr
- 103 Parkcrest Dr
- 106 Parkcrest Dr
- 803 Princeton Ct
- 801 Boston Dr
- 103 Harvard Dr
- 801 Princeton Ct
- 105 Parkcrest Dr
- 102 Yale Ct
- 100 Harvard Dr