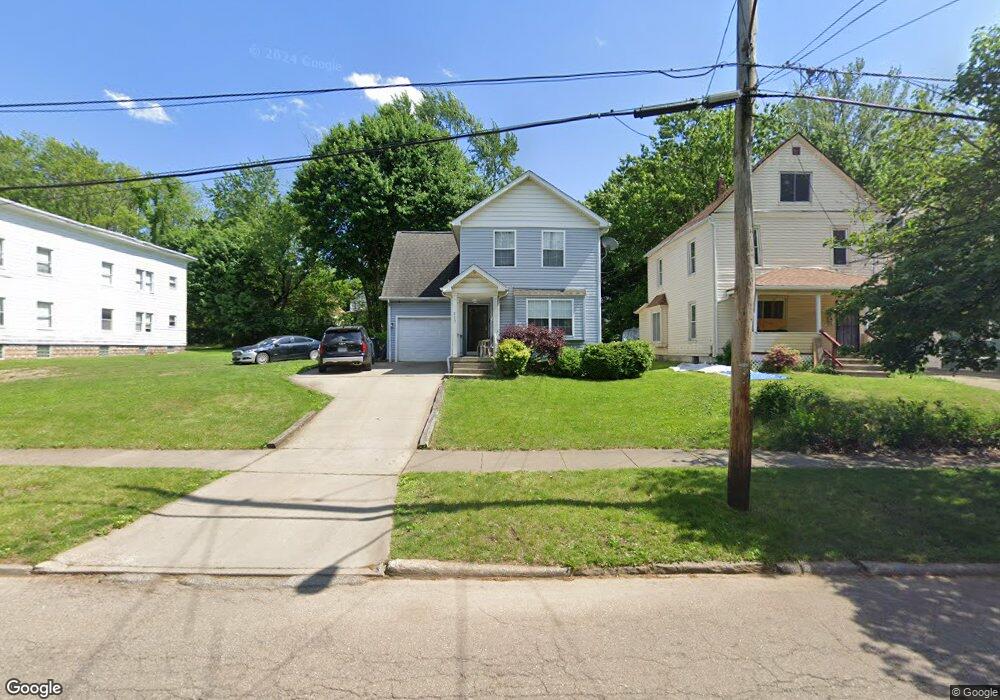
807 Boulevard St Akron, OH 44311
Summit Lake NeighborhoodEstimated Value: $94,000 - $141,000
4
Beds
2
Baths
1,383
Sq Ft
$83/Sq Ft
Est. Value
About This Home
This home is located at 807 Boulevard St, Akron, OH 44311 and is currently estimated at $114,667, approximately $82 per square foot. 807 Boulevard St is a home located in Summit County with nearby schools including North High School and St. Bernard-St. Mary Elementary School.
Ownership History
Date
Name
Owned For
Owner Type
Purchase Details
Closed on
Jan 26, 2017
Sold by
Summit County Land Reutilization
Bought by
Herring Loretta
Current Estimated Value
Purchase Details
Closed on
May 27, 2016
Sold by
Summit Lake Homes Limited Partnership
Bought by
Herring Loretta
Home Financials for this Owner
Home Financials are based on the most recent Mortgage that was taken out on this home.
Original Mortgage
$33,950
Interest Rate
3.64%
Purchase Details
Closed on
Sep 12, 2000
Sold by
Davis Keith E
Bought by
Summit Lake Homes Ltd Partnership
Purchase Details
Closed on
Aug 25, 2000
Sold by
Rozak Harold B
Bought by
Davis Keith E
Purchase Details
Closed on
Jan 19, 1999
Sold by
Faught Kim
Bought by
Rozak Harold B
Purchase Details
Closed on
Jan 9, 1999
Sold by
Love Inc
Bought by
Faught Kim
Purchase Details
Closed on
Dec 31, 1996
Sold by
Rodger A Mckay Trst
Bought by
Love Inc
Create a Home Valuation Report for This Property
The Home Valuation Report is an in-depth analysis detailing your home's value as well as a comparison with similar homes in the area
Home Values in the Area
Average Home Value in this Area
Purchase History
| Date | Buyer | Sale Price | Title Company |
|---|---|---|---|
| Herring Loretta | -- | None Available | |
| Herring Loretta | -- | -- | |
| Summit Lake Homes Ltd Partnership | $9,000 | Minnesota Title Agency Inc | |
| Davis Keith E | $100,000 | -- | |
| Rozak Harold B | $250 | -- | |
| Faught Kim | $500 | -- | |
| Love Inc | $500 | -- |
Source: Public Records
Mortgage History
| Date | Status | Borrower | Loan Amount |
|---|---|---|---|
| Previous Owner | Herring Loretta | $33,950 | |
| Previous Owner | Herring Loretta | -- |
Source: Public Records
Tax History
| Year | Tax Paid | Tax Assessment Tax Assessment Total Assessment is a certain percentage of the fair market value that is determined by local assessors to be the total taxable value of land and additions on the property. | Land | Improvement |
|---|---|---|---|---|
| 2024 | $712 | $19,573 | $6,024 | $13,549 |
| 2023 | $712 | $19,573 | $6,024 | $13,549 |
| 2022 | $360 | $11,516 | $3,546 | $7,970 |
| 2021 | $360 | $11,516 | $3,546 | $7,970 |
| 2020 | $358 | $11,520 | $3,550 | $7,970 |
| 2019 | $385 | $11,650 | $6,910 | $4,740 |
| 2018 | $382 | $11,650 | $6,910 | $4,740 |
| 2017 | $736 | $8,690 | $3,950 | $4,740 |
| 2016 | $737 | $8,820 | $3,950 | $4,870 |
| 2015 | $736 | $8,820 | $3,950 | $4,870 |
| 2014 | $731 | $8,820 | $3,950 | $4,870 |
| 2013 | $761 | $9,430 | $3,950 | $5,480 |
Source: Public Records
Map
Nearby Homes
- 834 Kenyon St
- 839 Kenyon St
- 258 Oberlin Ct
- 963 Morningstar Dr
- 163 Russell Ave
- 849 Amherst St
- 443 W Thornton St
- 829 Yale St
- 837 Yale St
- 858 May St
- 939 Lane St
- 108 Furnace Run Dr Unit 14108
- 994 Moeller Ave
- 89 Furnace Run Dr Unit 89
- 817 Raymond St
- 1011 Laurel Ave
- 131 W Miller Ave
- 121 Lake St
- 1021 La Croix Ave
- 198 Lake St
- 811 Boulevard St
- 803 Boulevard St
- 815 Boulevard St
- 819 Boulevard St
- 793 Boulevard St Unit 2
- 793 Boulevard St
- 793 Boulevard St Unit 1
- 818 Kenyon St
- 823 Boulevard St
- 804 Kenyon St
- 822 Kenyon St
- 800 Kenyon St
- 814 Boulevard St
- 808 Kenyon St
- 826 Kenyon St
- 789 Boulevard St
- 812 Boulevard St
- 808 Boulevard St
- 802 Boulevard St
- 830 Kenyon St
Your Personal Tour Guide
Ask me questions while you tour the home.