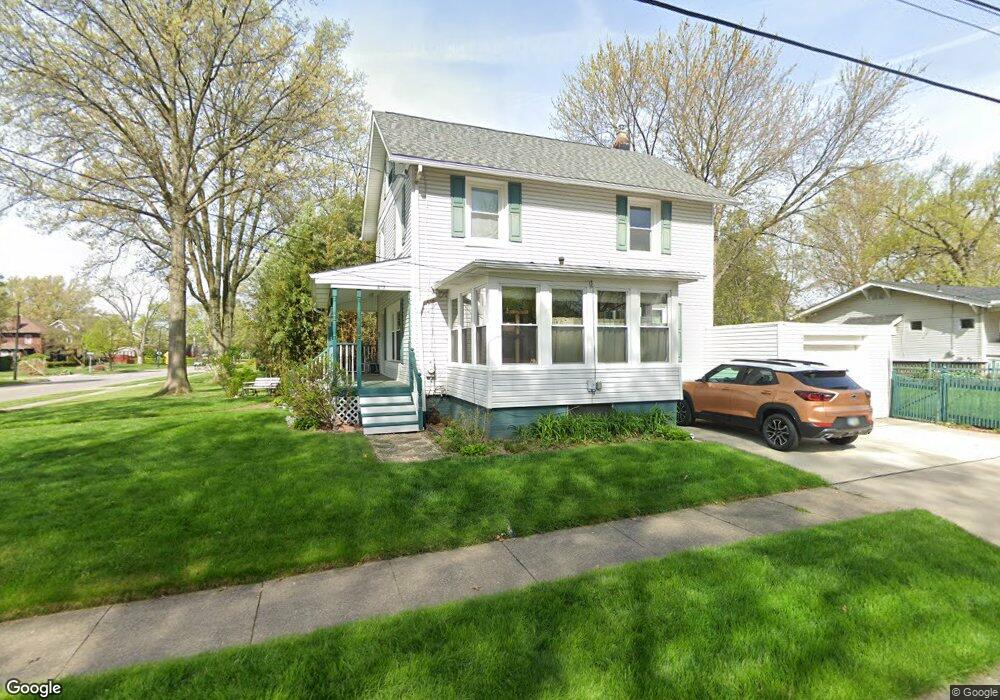
807 Chestnut Blvd Cuyahoga Falls, OH 44221
Southeast Cuyahoga Falls NeighborhoodEstimated Value: $178,000 - $247,055
3
Beds
1
Bath
1,858
Sq Ft
$119/Sq Ft
Est. Value
About This Home
This home is located at 807 Chestnut Blvd, Cuyahoga Falls, OH 44221 and is currently estimated at $220,764, approximately $118 per square foot. 807 Chestnut Blvd is a home located in Summit County with nearby schools including Dewitt Elementary School, Bolich Middle School, and Cuyahoga Falls High School.
Ownership History
Date
Name
Owned For
Owner Type
Purchase Details
Closed on
Oct 12, 2007
Sold by
Deutsche Bank National Trust Co
Bought by
Poston Erick J and Poston Vicky L
Current Estimated Value
Home Financials for this Owner
Home Financials are based on the most recent Mortgage that was taken out on this home.
Original Mortgage
$75,000
Outstanding Balance
$47,409
Interest Rate
6.45%
Mortgage Type
Purchase Money Mortgage
Estimated Equity
$173,355
Purchase Details
Closed on
Apr 11, 2007
Sold by
Michel Mary J
Bought by
Deutsche Bank National Trust Co and Argent Mortgage Securities Inc Asset Bac
Purchase Details
Closed on
Jul 11, 2005
Sold by
Hodges Marvin O and Michel Mary J
Bought by
Michel Mary J
Home Financials for this Owner
Home Financials are based on the most recent Mortgage that was taken out on this home.
Original Mortgage
$142,500
Interest Rate
8.88%
Mortgage Type
New Conventional
Purchase Details
Closed on
Mar 26, 1999
Sold by
Cartwright Darrell L and Cartwright Margaret J
Bought by
Hodges Marvin
Home Financials for this Owner
Home Financials are based on the most recent Mortgage that was taken out on this home.
Original Mortgage
$109,200
Interest Rate
9.5%
Create a Home Valuation Report for This Property
The Home Valuation Report is an in-depth analysis detailing your home's value as well as a comparison with similar homes in the area
Home Values in the Area
Average Home Value in this Area
Purchase History
| Date | Buyer | Sale Price | Title Company |
|---|---|---|---|
| Poston Erick J | $100,000 | Landcastle Title | |
| Deutsche Bank National Trust Co | $86,000 | None Available | |
| Michel Mary J | -- | -- | |
| Hodges Marvin | $109,200 | Trident Title Agency |
Source: Public Records
Mortgage History
| Date | Status | Borrower | Loan Amount |
|---|---|---|---|
| Open | Poston Erick J | $75,000 | |
| Previous Owner | Michel Mary J | $142,500 | |
| Previous Owner | Hodges Marvin | $109,200 |
Source: Public Records
Tax History Compared to Growth
Tax History
| Year | Tax Paid | Tax Assessment Tax Assessment Total Assessment is a certain percentage of the fair market value that is determined by local assessors to be the total taxable value of land and additions on the property. | Land | Improvement |
|---|---|---|---|---|
| 2025 | $3,621 | $67,075 | $12,408 | $54,667 |
| 2024 | $3,621 | $67,075 | $12,408 | $54,667 |
| 2023 | $3,621 | $67,075 | $12,408 | $54,667 |
| 2022 | $3,483 | $52,402 | $9,695 | $42,707 |
| 2021 | $3,483 | $52,402 | $9,695 | $42,707 |
| 2020 | $3,426 | $52,410 | $9,700 | $42,710 |
| 2019 | $3,262 | $45,450 | $9,500 | $35,950 |
| 2018 | $2,770 | $45,450 | $9,500 | $35,950 |
| 2017 | $2,448 | $45,450 | $9,500 | $35,950 |
| 2016 | $2,450 | $40,700 | $9,500 | $31,200 |
| 2015 | $2,448 | $40,700 | $9,500 | $31,200 |
| 2014 | $2,449 | $40,700 | $9,500 | $31,200 |
| 2013 | $2,290 | $38,390 | $9,500 | $28,890 |
Source: Public Records
Map
Nearby Homes
- 736 Chestnut Blvd
- 839 Sackett Ave
- 1839 9th St
- 1740 11th St
- 1523 8th St
- 419 Sackett Ave
- 1224 Chestnut Blvd
- 1510 2nd St
- 1757 3rd St
- 120 Grant Ave
- 1933 10th St
- 852 Arcadia Ave
- 1734 Front St Unit 34
- 1734 Front St Unit 37
- 1734 Front St Unit 36
- 1734 Front St Unit 35
- 807 Broad Blvd
- 1348 Grant Ave
- 1333 Meriline St
- 2104 7th St