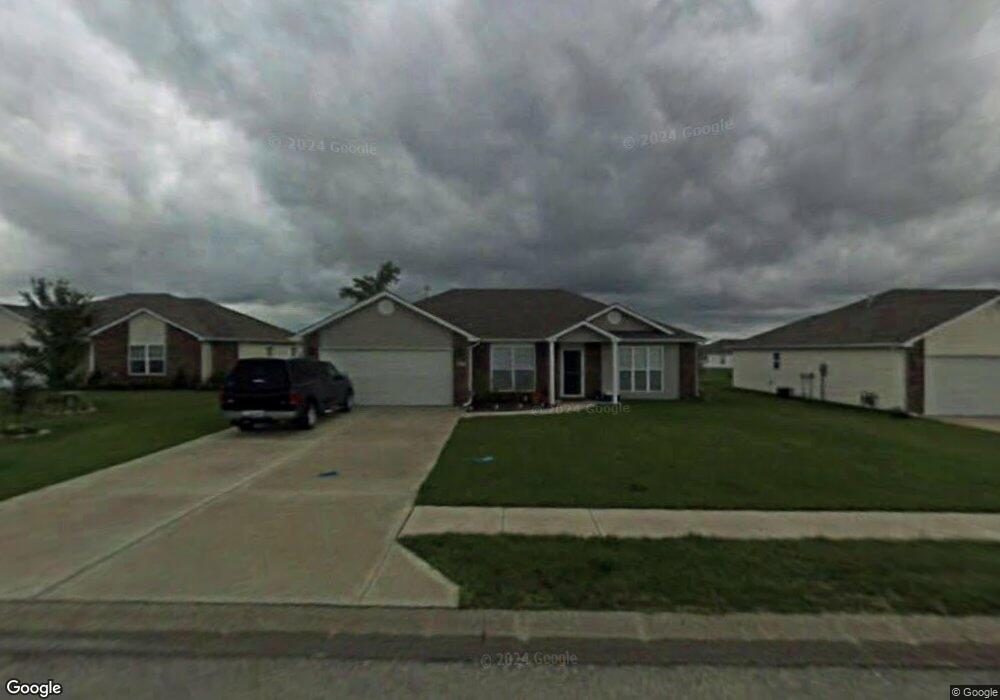
807 Clancy Ct Raymore, MO 64083
Estimated Value: $293,000 - $316,000
3
Beds
2
Baths
1,525
Sq Ft
$199/Sq Ft
Est. Value
About This Home
This home is located at 807 Clancy Ct, Raymore, MO 64083 and is currently estimated at $303,843, approximately $199 per square foot. 807 Clancy Ct is a home located in Cass County with nearby schools including Stonegate Elementary School, Raymore-Peculiar South Middle School, and Raymore-Peculiar Senior High School.
Ownership History
Date
Name
Owned For
Owner Type
Purchase Details
Closed on
Mar 12, 2014
Sold by
Willis Christopher and Willis Audrey J
Bought by
Willis William D
Current Estimated Value
Home Financials for this Owner
Home Financials are based on the most recent Mortgage that was taken out on this home.
Original Mortgage
$124,200
Outstanding Balance
$93,656
Interest Rate
4.36%
Mortgage Type
New Conventional
Estimated Equity
$210,187
Purchase Details
Closed on
Jun 9, 2006
Sold by
Willis Christopher
Bought by
Willis Christopher and Bruno Audrey
Purchase Details
Closed on
Feb 16, 2006
Sold by
Collier Wendy L
Bought by
Willis Christopher
Home Financials for this Owner
Home Financials are based on the most recent Mortgage that was taken out on this home.
Original Mortgage
$109,600
Interest Rate
6.15%
Mortgage Type
New Conventional
Create a Home Valuation Report for This Property
The Home Valuation Report is an in-depth analysis detailing your home's value as well as a comparison with similar homes in the area
Home Values in the Area
Average Home Value in this Area
Purchase History
| Date | Buyer | Sale Price | Title Company |
|---|---|---|---|
| Willis William D | -- | Cbkc Title & Escrow Llc | |
| Willis Christopher | -- | -- | |
| Willis Christopher | -- | -- |
Source: Public Records
Mortgage History
| Date | Status | Borrower | Loan Amount |
|---|---|---|---|
| Open | Willis William D | $124,200 | |
| Previous Owner | Willis Christopher | $109,600 |
Source: Public Records
Tax History
| Year | Tax Paid | Tax Assessment Tax Assessment Total Assessment is a certain percentage of the fair market value that is determined by local assessors to be the total taxable value of land and additions on the property. | Land | Improvement |
|---|---|---|---|---|
| 2025 | $2,735 | $37,580 | $6,060 | $31,520 |
| 2024 | $2,735 | $33,610 | $5,510 | $28,100 |
| 2023 | $2,732 | $33,610 | $5,510 | $28,100 |
| 2022 | $2,472 | $30,210 | $5,510 | $24,700 |
| 2021 | $2,472 | $30,210 | $5,510 | $24,700 |
| 2020 | $2,475 | $29,710 | $5,510 | $24,200 |
| 2019 | $2,389 | $29,710 | $5,510 | $24,200 |
| 2018 | $2,199 | $26,410 | $4,590 | $21,820 |
| 2017 | $2,014 | $26,410 | $4,590 | $21,820 |
| 2016 | $2,014 | $25,110 | $4,590 | $20,520 |
| 2015 | $2,016 | $25,110 | $4,590 | $20,520 |
| 2014 | $1,923 | $23,940 | $4,590 | $19,350 |
| 2013 | -- | $23,940 | $4,590 | $19,350 |
Source: Public Records
Map
Nearby Homes
- 817 Clancy Ct
- 713 S Sunset Ln
- 901 W Lucy Webb Rd
- 1103 Carlisle Dr
- 1105 Creekside Ct
- 1112 Carlisle Dr
- 1108 Yokley Dr
- 709 Derby St
- 1510 Colt Cir
- 1519 Colt Cir
- 1024 S Madison St
- 108 Rainbow Cir
- 804 S Washington St
- 201 Johnston Dr
- 1205 Sendera Trail
- 1228 Larkspur Place
- 1301 Larkspur Place
- 1227 Larkspur Place
- 1309 Larkspur Place
- 1035 Mission Park Trail
Your Personal Tour Guide
Ask me questions while you tour the home.