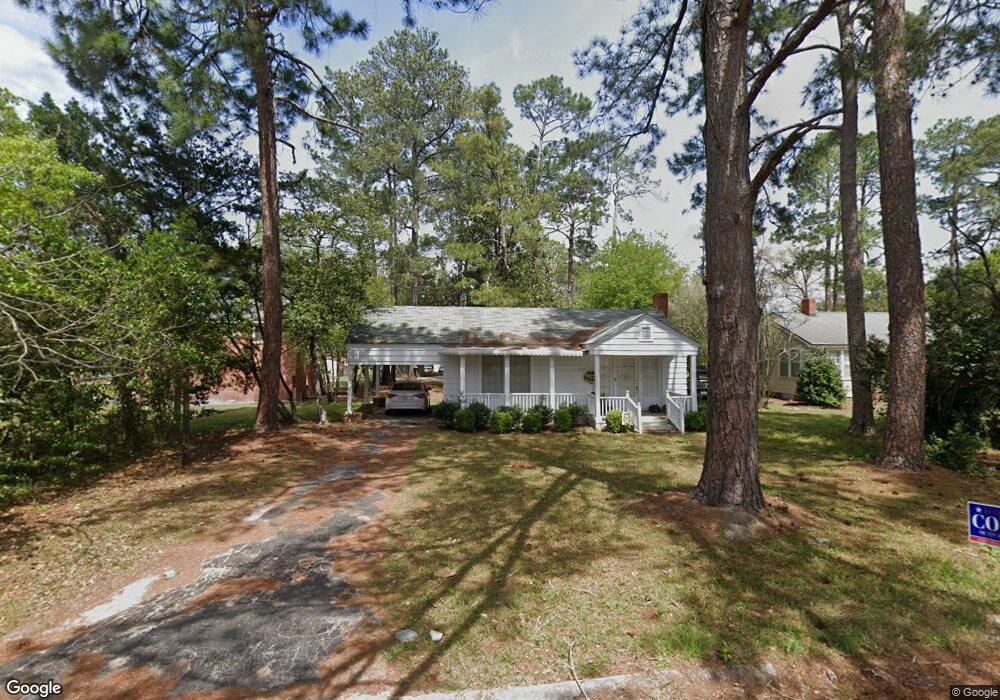
807 E 18th Ave Cordele, GA 31015
Estimated Value: $80,271 - $126,000
2
Beds
1
Bath
1,260
Sq Ft
$82/Sq Ft
Est. Value
About This Home
This home is located at 807 E 18th Ave, Cordele, GA 31015 and is currently estimated at $103,318, approximately $81 per square foot. 807 E 18th Ave is a home located in Crisp County with nearby schools including Crisp County Elementary School, Crisp County Primary School, and Crisp County Middle School.
Ownership History
Date
Name
Owned For
Owner Type
Purchase Details
Closed on
Jan 1, 2007
Sold by
Rahu Properties Inc
Bought by
Rahu Properties Inc
Current Estimated Value
Purchase Details
Closed on
Nov 23, 2005
Sold by
Folds Title Co Inc
Bought by
Rahu Properties Inc
Purchase Details
Closed on
Nov 14, 2003
Sold by
Folds Amy N Miller and Thomas Sh
Bought by
Folds Title Company Inc
Purchase Details
Closed on
Dec 31, 2001
Sold by
Miller Amy N
Bought by
Folds Amy N Miller and Thomas Shane
Purchase Details
Closed on
Dec 18, 1997
Sold by
Fitzgibbons Joyce V
Bought by
Miller Amy N
Purchase Details
Closed on
Sep 10, 1997
Sold by
Legge John J and Legge Ann
Bought by
Fitzgibbons Joyce V
Purchase Details
Closed on
Dec 14, 1973
Sold by
Smith Faye
Bought by
Legge John J and Legge Ann
Purchase Details
Closed on
Nov 27, 1945
Bought by
Smith Faye
Create a Home Valuation Report for This Property
The Home Valuation Report is an in-depth analysis detailing your home's value as well as a comparison with similar homes in the area
Purchase History
| Date | Buyer | Sale Price | Title Company |
|---|---|---|---|
| Rahu Properties Inc | $79,900 | -- | |
| Rahu Properties Inc | $51,000 | -- | |
| Folds Title Company Inc | -- | -- | |
| Folds Amy N Miller | -- | -- | |
| Miller Amy N | $48,500 | -- | |
| Fitzgibbons Joyce V | -- | -- | |
| Legge John J | -- | -- | |
| Smith Faye | -- | -- |
Source: Public Records
Mortgage History
| Date | Status | Borrower | Loan Amount |
|---|---|---|---|
| Closed | Rahu Properties Inc | $0 |
Source: Public Records
Tax History
| Year | Tax Paid | Tax Assessment Tax Assessment Total Assessment is a certain percentage of the fair market value that is determined by local assessors to be the total taxable value of land and additions on the property. | Land | Improvement |
|---|---|---|---|---|
| 2025 | $1,043 | $29,561 | $3,079 | $26,482 |
| 2024 | $970 | $27,070 | $3,079 | $23,991 |
| 2023 | $912 | $24,320 | $1,540 | $22,780 |
| 2022 | $610 | $23,074 | $1,540 | $21,534 |
| 2021 | $598 | $21,829 | $1,540 | $20,289 |
| 2020 | $614 | $21,829 | $1,540 | $20,289 |
| 2019 | $619 | $21,829 | $1,540 | $20,289 |
| 2018 | $610 | $20,683 | $2,925 | $17,758 |
| 2017 | $840 | $20,683 | $2,925 | $17,758 |
| 2016 | $612 | $20,683 | $2,925 | $17,758 |
| 2015 | -- | $20,683 | $2,925 | $17,758 |
| 2014 | -- | $20,683 | $2,925 | $17,758 |
| 2013 | -- | $20,683 | $2,925 | $17,758 |
Source: Public Records
Map
Nearby Homes
Your Personal Tour Guide
Ask me questions while you tour the home.