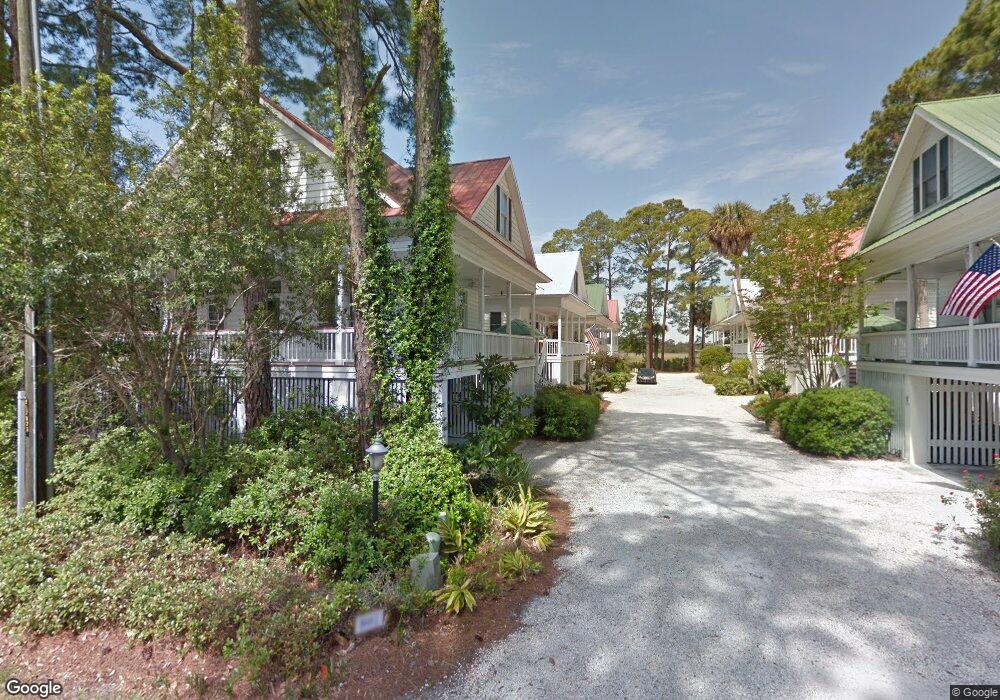
807 Jones Ave Tybee Island, GA 31328
Estimated Value: $655,000 - $746,000
3
Beds
3
Baths
1,559
Sq Ft
$453/Sq Ft
Est. Value
About This Home
This home is located at 807 Jones Ave, Tybee Island, GA 31328 and is currently estimated at $706,944, approximately $453 per square foot. 807 Jones Ave is a home located in Chatham County with nearby schools including Howard Elementary School, Coastal Middle School, and Islands High School.
Ownership History
Date
Name
Owned For
Owner Type
Purchase Details
Closed on
Feb 11, 2021
Sold by
Howard Frederick A
Bought by
Howard Fred Alan and Howard Deborah Mahany
Current Estimated Value
Home Financials for this Owner
Home Financials are based on the most recent Mortgage that was taken out on this home.
Original Mortgage
$175,000
Outstanding Balance
$128,821
Interest Rate
2.7%
Mortgage Type
New Conventional
Estimated Equity
$578,123
Purchase Details
Closed on
Oct 5, 2020
Sold by
Howard Shelly H
Bought by
Howard Frederick A
Create a Home Valuation Report for This Property
The Home Valuation Report is an in-depth analysis detailing your home's value as well as a comparison with similar homes in the area
Home Values in the Area
Average Home Value in this Area
Purchase History
| Date | Buyer | Sale Price | Title Company |
|---|---|---|---|
| Howard Fred Alan | -- | -- | |
| Howard Frederick A | -- | -- |
Source: Public Records
Mortgage History
| Date | Status | Borrower | Loan Amount |
|---|---|---|---|
| Open | Howard Fred Alan | $175,000 |
Source: Public Records
Tax History Compared to Growth
Tax History
| Year | Tax Paid | Tax Assessment Tax Assessment Total Assessment is a certain percentage of the fair market value that is determined by local assessors to be the total taxable value of land and additions on the property. | Land | Improvement |
|---|---|---|---|---|
| 2025 | $6,994 | $245,400 | $85,800 | $159,600 |
| 2024 | $6,994 | $246,640 | $85,800 | $160,840 |
| 2023 | $6,031 | $233,440 | $79,200 | $154,240 |
| 2022 | $6,752 | $232,240 | $79,200 | $153,040 |
| 2021 | $5,394 | $221,480 | $35,640 | $185,840 |
| 2020 | $4,663 | $150,000 | $35,920 | $114,080 |
| 2019 | $4,662 | $150,000 | $35,920 | $114,080 |
| 2018 | $3,646 | $182,440 | $35,920 | $146,520 |
| 2017 | $3,911 | $136,760 | $38,360 | $98,400 |
| 2016 | $3,381 | $120,320 | $38,360 | $81,960 |
| 2015 | $3,262 | $116,450 | $38,578 | $77,872 |
| 2014 | $4,801 | $116,450 | $0 | $0 |
Source: Public Records
Map
Nearby Homes
- 807 Jones Ave Unit G
- 3 Marsh Creek Cove
- 716 Jones Ave
- 708 Jones Ave
- 911 Jones Ave
- 702 Lovell Ave
- 605 6th St Unit A
- 605 6th St Unit B
- 605 6th St
- 603 Butler Ave Unit 20
- 1004 2nd Ave
- 5 Ocean Dr
- 7 9th Terrace
- 606 Butler Ave
- 1011 Lovell Ave
- 1017 Lovell Ave
- 9 10th St
- 409 Miller Ave
- 10 10th Terrace
- 5 10th St