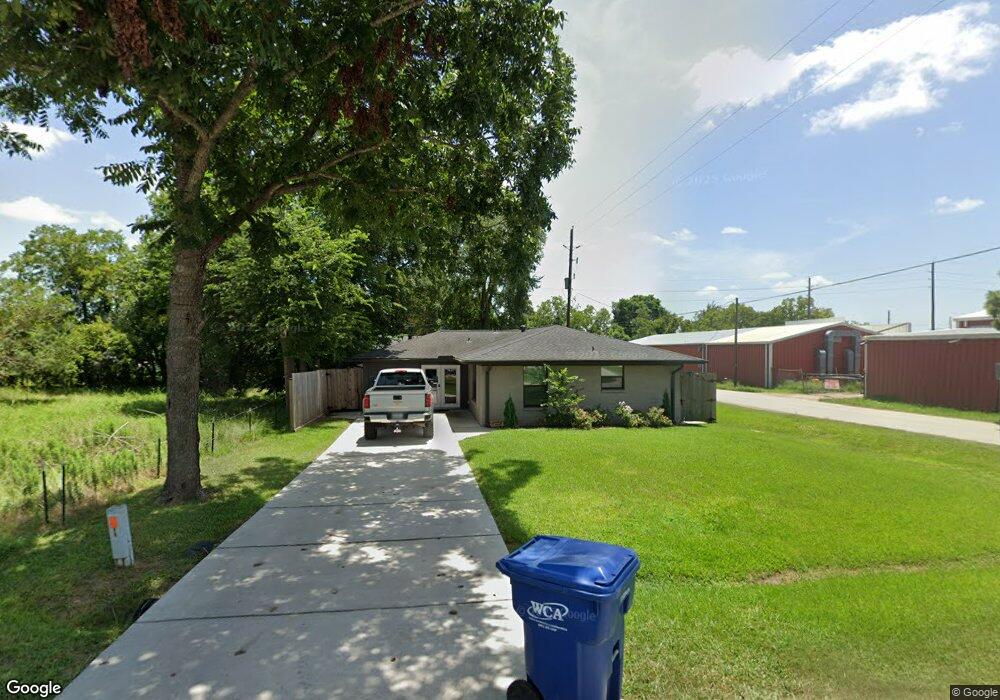
807 Larue St Magnolia, TX 77355
Estimated Value: $208,000
--
Bed
1
Bath
1,304
Sq Ft
$160/Sq Ft
Est. Value
About This Home
This home is located at 807 Larue St, Magnolia, TX 77355 and is currently estimated at $208,000, approximately $159 per square foot. 807 Larue St is a home located in Montgomery County with nearby schools including Magnolia Elementary School, Magnolia Sixth Grade Campus, and Magnolia Junior High School.
Ownership History
Date
Name
Owned For
Owner Type
Purchase Details
Closed on
Dec 27, 2019
Sold by
Sturges Jennifer L
Bought by
Carmichael Tammy
Current Estimated Value
Purchase Details
Closed on
May 23, 2019
Sold by
Masden William
Bought by
Carmichael Tammy
Purchase Details
Closed on
Dec 6, 2018
Sold by
Garner Mike H
Bought by
Camichael Tammy and Masden William
Purchase Details
Closed on
Feb 10, 2007
Sold by
Garner Mike H
Bought by
Sturges Jennifer L
Purchase Details
Closed on
Nov 8, 2005
Sold by
Vaja Baker Terri Lynn and Vaja Jerry Wayne
Bought by
Garner Mike H
Purchase Details
Closed on
Dec 20, 2004
Sold by
Vaja Geraldine Marie Est Of
Bought by
Garner Michael H and Garner Cory L
Purchase Details
Closed on
Nov 11, 2004
Sold by
Vaja Baker Terri Lynn
Bought by
Vaja Baker Terri Lynn and Vaja Jerry Wayne
Create a Home Valuation Report for This Property
The Home Valuation Report is an in-depth analysis detailing your home's value as well as a comparison with similar homes in the area
Home Values in the Area
Average Home Value in this Area
Purchase History
| Date | Buyer | Sale Price | Title Company |
|---|---|---|---|
| Carmichael Tammy | -- | None Available | |
| Carmichael Tammy | -- | None Available | |
| Camichael Tammy | -- | None Available | |
| Sturges Jennifer L | -- | None Available | |
| Garner Mike H | -- | -- | |
| Garner Michael H | -- | -- | |
| Vaja Baker Terri Lynn | -- | -- |
Source: Public Records
Tax History Compared to Growth
Tax History
| Year | Tax Paid | Tax Assessment Tax Assessment Total Assessment is a certain percentage of the fair market value that is determined by local assessors to be the total taxable value of land and additions on the property. | Land | Improvement |
|---|---|---|---|---|
| 2025 | $1,517 | $144,136 | $30,006 | $114,130 |
| 2024 | $1,517 | $82,720 | $30,010 | $52,710 |
| 2023 | $1,604 | $85,600 | $30,010 | $55,590 |
| 2022 | $1,832 | $85,600 | $30,010 | $55,590 |
| 2021 | $1,614 | $71,280 | $30,010 | $41,270 |
| 2020 | $1,224 | $49,190 | $5,000 | $44,190 |
| 2019 | $1,238 | $49,890 | $5,000 | $44,890 |
| 2018 | $1,163 | $45,060 | $5,000 | $40,060 |
| 2017 | $1,164 | $45,060 | $5,000 | $40,060 |
| 2016 | $1,102 | $42,650 | $5,000 | $37,650 |
| 2015 | $1,093 | $39,760 | $5,000 | $34,760 |
| 2014 | $1,093 | $41,930 | $5,000 | $36,930 |
Source: Public Records
Map
Nearby Homes
- San Gabriel Plan at The Oaks On 6th Street - The Oaks on 6th Street
- Zacate Plan at The Oaks On 6th Street - The Oaks on 6th Street
- Nolan Plan at The Oaks On 6th Street - The Oaks on 6th Street
- Salado Plan at The Oaks On 6th Street - The Oaks on 6th Street
- Dickinson Plan at The Oaks On 6th Street - The Oaks on 6th Street
- Highlander Plan at The Oaks On 6th Street - The Oaks on 6th Street
- 26774 Frontier Trace Dr
- 26783 Frontier Trace Dr
- Melrose II Plan at The Stableton District at Kresston - Kresston
- 27003 W Rustlers Bend
- Wakefield II Plan at The Stableton District at Kresston - Kresston
- 26779 Frontier Trace Dr
- 26778 Frontier Trace Dr
- Cantaron II Plan at The Stableton District at Kresston - Kresston
- Glenbrook II Plan at The Stableton District at Kresston - Kresston
- 26795 Frontier Trace Dr
- 26790 Frontier Trace Dr
- Oak Hill IV Plan at The Stableton District at Kresston - Kresston
- Somerset Plan at The Stableton District at Kresston - Kresston
- 26794 Frontier Trace Dr