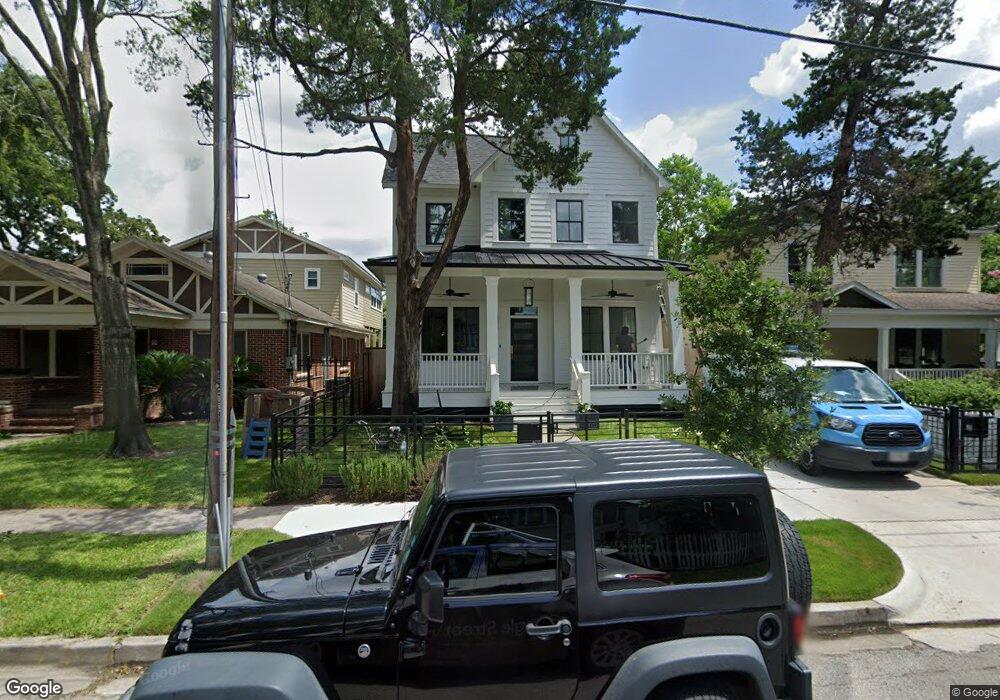
807 Merrill St Houston, TX 77009
Greater Heights NeighborhoodEstimated Value: $1,635,000 - $2,086,000
3
Beds
4
Baths
1,328
Sq Ft
$1,365/Sq Ft
Est. Value
About This Home
This home is located at 807 Merrill St, Houston, TX 77009 and is currently estimated at $1,812,442, approximately $1,364 per square foot. 807 Merrill St is a home located in Harris County with nearby schools including Travis Elementary School, Hogg Middle, and Heights High School.
Ownership History
Date
Name
Owned For
Owner Type
Purchase Details
Closed on
Dec 26, 2017
Sold by
Blue Letter Initives Inc
Bought by
York Ryan and York Catherine
Current Estimated Value
Home Financials for this Owner
Home Financials are based on the most recent Mortgage that was taken out on this home.
Original Mortgage
$963,350
Outstanding Balance
$800,803
Interest Rate
3.37%
Mortgage Type
Adjustable Rate Mortgage/ARM
Estimated Equity
$1,011,639
Purchase Details
Closed on
May 1, 2017
Sold by
Jenkins Michael D
Bought by
Blue Letter Initiatives Llc
Create a Home Valuation Report for This Property
The Home Valuation Report is an in-depth analysis detailing your home's value as well as a comparison with similar homes in the area
Home Values in the Area
Average Home Value in this Area
Purchase History
| Date | Buyer | Sale Price | Title Company |
|---|---|---|---|
| York Ryan | -- | Fidelity National Title | |
| Blue Letter Initiatives Llc | -- | None Available |
Source: Public Records
Mortgage History
| Date | Status | Borrower | Loan Amount |
|---|---|---|---|
| Open | York Ryan | $963,350 |
Source: Public Records
Tax History Compared to Growth
Tax History
| Year | Tax Paid | Tax Assessment Tax Assessment Total Assessment is a certain percentage of the fair market value that is determined by local assessors to be the total taxable value of land and additions on the property. | Land | Improvement |
|---|---|---|---|---|
| 2025 | $25,077 | $1,577,979 | $537,500 | $1,040,479 |
| 2024 | $25,077 | $1,573,757 | $537,500 | $1,036,257 |
| 2023 | $25,077 | $1,501,961 | $483,750 | $1,018,211 |
| 2022 | $28,157 | $1,351,552 | $446,125 | $905,427 |
| 2021 | $27,095 | $1,162,525 | $430,000 | $732,525 |
| 2020 | $27,783 | $1,147,300 | $430,000 | $717,300 |
| 2019 | $27,728 | $1,095,790 | $430,000 | $665,790 |
| 2018 | $21,386 | $1,066,058 | $344,000 | $722,058 |
| 2017 | $10,175 | $402,406 | $344,000 | $58,406 |
| 2016 | $9,375 | $370,750 | $332,000 | $38,750 |
| 2015 | $7,712 | $369,656 | $311,250 | $58,406 |
| 2014 | $7,712 | $300,000 | $280,125 | $19,875 |
Source: Public Records
Map
Nearby Homes