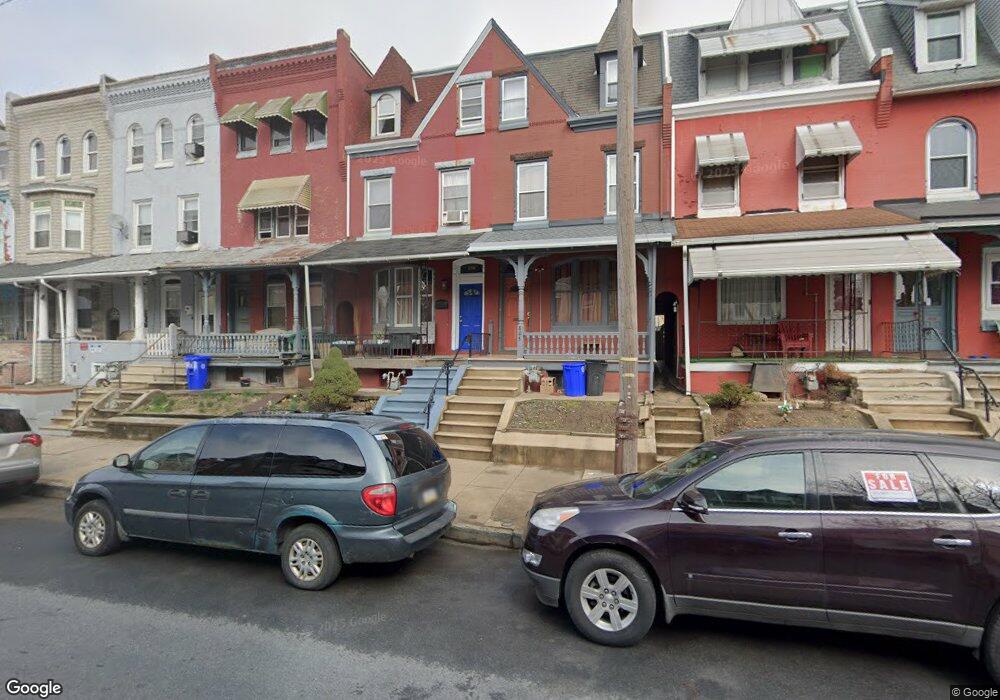
807 N 11th St Reading, PA 19604
District 6 NeighborhoodEstimated Value: $169,304 - $191,000
5
Beds
1
Bath
2,004
Sq Ft
$90/Sq Ft
Est. Value
About This Home
This home is located at 807 N 11th St, Reading, PA 19604 and is currently estimated at $180,576, approximately $90 per square foot. 807 N 11th St is a home located in Berks County with nearby schools including Twelfth & Marion Elementary School, Northeast Middle School, and Reading Senior High School.
Ownership History
Date
Name
Owned For
Owner Type
Purchase Details
Closed on
Mar 17, 2006
Sold by
J&B Investments
Bought by
Perez Jose U
Current Estimated Value
Home Financials for this Owner
Home Financials are based on the most recent Mortgage that was taken out on this home.
Original Mortgage
$5,000
Outstanding Balance
$2,867
Interest Rate
6.32%
Mortgage Type
Stand Alone Second
Estimated Equity
$177,709
Purchase Details
Closed on
Mar 16, 2006
Sold by
Fox Richard A
Bought by
J & B Investments
Home Financials for this Owner
Home Financials are based on the most recent Mortgage that was taken out on this home.
Original Mortgage
$5,000
Outstanding Balance
$2,867
Interest Rate
6.32%
Mortgage Type
Stand Alone Second
Estimated Equity
$177,709
Create a Home Valuation Report for This Property
The Home Valuation Report is an in-depth analysis detailing your home's value as well as a comparison with similar homes in the area
Home Values in the Area
Average Home Value in this Area
Purchase History
| Date | Buyer | Sale Price | Title Company |
|---|---|---|---|
| Perez Jose U | $55,000 | Conestoga Title Insurance | |
| J & B Investments | $19,000 | None Available | |
| J & B Investments | $19,000 | None Available |
Source: Public Records
Mortgage History
| Date | Status | Borrower | Loan Amount |
|---|---|---|---|
| Open | Perez Jose U | $5,000 | |
| Open | Perez Jose U | $53,350 |
Source: Public Records
Tax History Compared to Growth
Tax History
| Year | Tax Paid | Tax Assessment Tax Assessment Total Assessment is a certain percentage of the fair market value that is determined by local assessors to be the total taxable value of land and additions on the property. | Land | Improvement |
|---|---|---|---|---|
| 2025 | $1,129 | $41,600 | $13,000 | $28,600 |
| 2024 | $1,847 | $41,600 | $13,000 | $28,600 |
| 2023 | $1,819 | $41,600 | $13,000 | $28,600 |
| 2022 | $1,819 | $41,600 | $13,000 | $28,600 |
| 2021 | $1,819 | $41,600 | $13,000 | $28,600 |
| 2020 | $1,800 | $41,600 | $13,000 | $28,600 |
| 2019 | $1,800 | $41,600 | $13,000 | $28,600 |
| 2018 | $1,800 | $41,600 | $13,000 | $28,600 |
| 2017 | $1,788 | $41,600 | $13,000 | $28,600 |
| 2016 | $1,022 | $41,600 | $13,000 | $28,600 |
| 2015 | $1,022 | $41,600 | $13,000 | $28,600 |
| 2014 | $940 | $41,600 | $13,000 | $28,600 |
Source: Public Records
Map
Nearby Homes