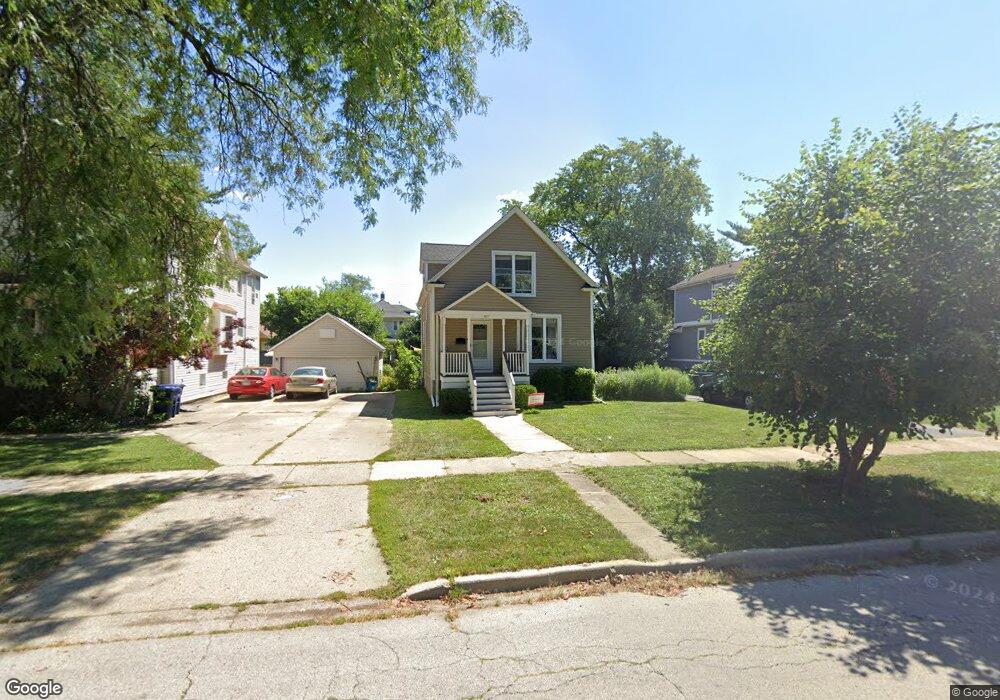
807 N 3rd Ave Maywood, IL 60153
North Maywood NeighborhoodEstimated Value: $294,000 - $332,000
3
Beds
2
Baths
1,465
Sq Ft
$214/Sq Ft
Est. Value
About This Home
This home is located at 807 N 3rd Ave, Maywood, IL 60153 and is currently estimated at $313,340, approximately $213 per square foot. 807 N 3rd Ave is a home located in Cook County with nearby schools including Lincoln Elementary School, Stevenson Middle School, and Proviso East High School.
Ownership History
Date
Name
Owned For
Owner Type
Purchase Details
Closed on
Apr 21, 2014
Sold by
Starrick Michael D and Starrick Cheryl
Bought by
Starrick Michael D and Starrick Cheryl
Current Estimated Value
Purchase Details
Closed on
Sep 28, 2012
Sold by
Hohnson Stanley H
Bought by
Starrick Michael D
Purchase Details
Closed on
May 16, 2000
Sold by
Johnson Stanley H and Johnson Mary E
Bought by
Johnson Stanley H and Johnson Mary E
Create a Home Valuation Report for This Property
The Home Valuation Report is an in-depth analysis detailing your home's value as well as a comparison with similar homes in the area
Home Values in the Area
Average Home Value in this Area
Purchase History
| Date | Buyer | Sale Price | Title Company |
|---|---|---|---|
| Starrick Michael D | -- | Cti | |
| Starrick Michael D | $43,000 | Fidelity National Title | |
| Johnson Stanley H | -- | -- |
Source: Public Records
Tax History Compared to Growth
Tax History
| Year | Tax Paid | Tax Assessment Tax Assessment Total Assessment is a certain percentage of the fair market value that is determined by local assessors to be the total taxable value of land and additions on the property. | Land | Improvement |
|---|---|---|---|---|
| 2024 | $7,804 | $21,430 | $3,995 | $17,435 |
| 2023 | $8,088 | $21,430 | $3,995 | $17,435 |
| 2022 | $8,088 | $17,787 | $3,450 | $14,337 |
| 2021 | $8,172 | $17,786 | $3,449 | $14,337 |
| 2020 | $8,093 | $17,786 | $3,449 | $14,337 |
| 2019 | $7,230 | $14,872 | $3,086 | $11,786 |
| 2018 | $7,030 | $14,872 | $3,086 | $11,786 |
| 2017 | $6,829 | $14,872 | $3,086 | $11,786 |
| 2016 | $6,700 | $13,285 | $2,723 | $10,562 |
| 2015 | $6,172 | $13,285 | $2,723 | $10,562 |
| 2014 | $5,673 | $13,285 | $2,723 | $10,562 |
| 2013 | $5,835 | $14,693 | $2,723 | $11,970 |
Source: Public Records
Map
Nearby Homes