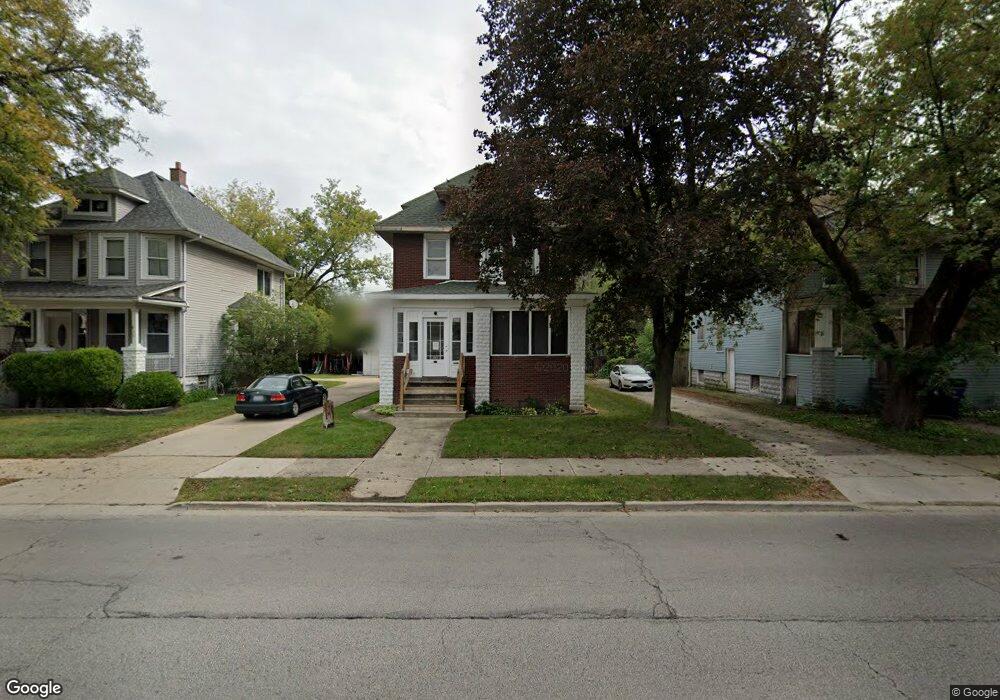
807 N 5th Ave Maywood, IL 60153
North Maywood NeighborhoodEstimated Value: $274,000 - $304,000
4
Beds
2
Baths
1,536
Sq Ft
$185/Sq Ft
Est. Value
About This Home
This home is located at 807 N 5th Ave, Maywood, IL 60153 and is currently estimated at $284,665, approximately $185 per square foot. 807 N 5th Ave is a home located in Cook County with nearby schools including Lincoln Elementary School, Stevenson Middle School, and Proviso East High School.
Ownership History
Date
Name
Owned For
Owner Type
Purchase Details
Closed on
Jul 7, 2025
Sold by
Loandepotcom Llc
Bought by
Vimawala Iram
Current Estimated Value
Purchase Details
Closed on
Jul 26, 2023
Sold by
Intercounty Judicial Sales Corporation
Bought by
Loandepotcom Llc
Purchase Details
Closed on
Mar 22, 2006
Sold by
Baker John
Bought by
Baker John and Baker Patricia
Purchase Details
Closed on
Oct 22, 1997
Sold by
Fleet Finance Inc
Bought by
Baker John
Home Financials for this Owner
Home Financials are based on the most recent Mortgage that was taken out on this home.
Original Mortgage
$93,100
Interest Rate
7.65%
Create a Home Valuation Report for This Property
The Home Valuation Report is an in-depth analysis detailing your home's value as well as a comparison with similar homes in the area
Home Values in the Area
Average Home Value in this Area
Purchase History
| Date | Buyer | Sale Price | Title Company |
|---|---|---|---|
| Vimawala Iram | $126,000 | Chicago Title | |
| Loandepotcom Llc | -- | None Listed On Document | |
| Baker John | -- | None Available | |
| Baker John | $65,333 | -- |
Source: Public Records
Mortgage History
| Date | Status | Borrower | Loan Amount |
|---|---|---|---|
| Previous Owner | Baker John | $93,100 |
Source: Public Records
Tax History Compared to Growth
Tax History
| Year | Tax Paid | Tax Assessment Tax Assessment Total Assessment is a certain percentage of the fair market value that is determined by local assessors to be the total taxable value of land and additions on the property. | Land | Improvement |
|---|---|---|---|---|
| 2024 | $7,619 | $21,000 | $1,915 | $19,085 |
| 2023 | $5,955 | $21,000 | $1,915 | $19,085 |
| 2022 | $5,955 | $13,999 | $1,654 | $12,345 |
| 2021 | $6,030 | $13,998 | $1,653 | $12,345 |
| 2020 | $6,005 | $13,998 | $1,653 | $12,345 |
| 2019 | $5,935 | $12,823 | $1,479 | $11,344 |
| 2018 | $5,770 | $12,823 | $1,479 | $11,344 |
| 2017 | $5,612 | $12,823 | $1,479 | $11,344 |
| 2016 | $5,356 | $11,121 | $1,305 | $9,816 |
| 2015 | $4,919 | $11,121 | $1,305 | $9,816 |
| 2014 | $3,556 | $11,121 | $1,305 | $9,816 |
| 2013 | $5,181 | $13,341 | $1,305 | $12,036 |
Source: Public Records
Map
Nearby Homes