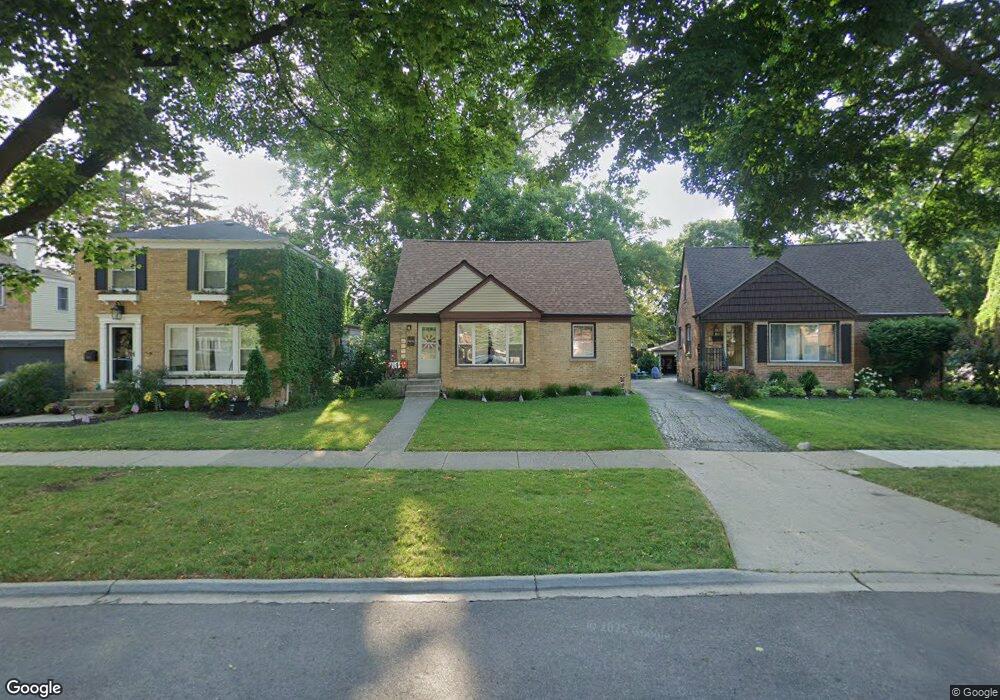
807 N Princeton Ave Arlington Heights, IL 60004
Estimated Value: $363,000 - $442,212
3
Beds
2
Baths
1,242
Sq Ft
$336/Sq Ft
Est. Value
About This Home
This home is located at 807 N Princeton Ave, Arlington Heights, IL 60004 and is currently estimated at $417,303, approximately $335 per square foot. 807 N Princeton Ave is a home located in Cook County with nearby schools including Patton Elementary School, Thomas Middle School, and John Hersey High School.
Ownership History
Date
Name
Owned For
Owner Type
Purchase Details
Closed on
Aug 15, 2019
Sold by
Gustafson James W and Gustafson Anita
Bought by
Lill Steven
Current Estimated Value
Home Financials for this Owner
Home Financials are based on the most recent Mortgage that was taken out on this home.
Original Mortgage
$187,000
Outstanding Balance
$163,097
Interest Rate
3.5%
Mortgage Type
New Conventional
Estimated Equity
$254,206
Purchase Details
Closed on
Mar 7, 2018
Sold by
Gustafson James W and Gustafson Anita M
Bought by
Gustafson Anita M and Gustafson James W
Purchase Details
Closed on
May 31, 2002
Sold by
Harris Trust & Svgs Bank
Bought by
Gustafson James W
Home Financials for this Owner
Home Financials are based on the most recent Mortgage that was taken out on this home.
Original Mortgage
$125,000
Interest Rate
6.62%
Create a Home Valuation Report for This Property
The Home Valuation Report is an in-depth analysis detailing your home's value as well as a comparison with similar homes in the area
Home Values in the Area
Average Home Value in this Area
Purchase History
| Date | Buyer | Sale Price | Title Company |
|---|---|---|---|
| Lill Steven | $220,000 | Chicago Title | |
| Gustafson Anita M | -- | Attorney | |
| Gustafson James W | -- | Chicago Title Insurance Co |
Source: Public Records
Mortgage History
| Date | Status | Borrower | Loan Amount |
|---|---|---|---|
| Open | Lill Steven | $187,000 | |
| Previous Owner | Gustafson James W | $125,000 |
Source: Public Records
Tax History Compared to Growth
Tax History
| Year | Tax Paid | Tax Assessment Tax Assessment Total Assessment is a certain percentage of the fair market value that is determined by local assessors to be the total taxable value of land and additions on the property. | Land | Improvement |
|---|---|---|---|---|
| 2024 | $6,345 | $26,492 | $5,726 | $20,766 |
| 2023 | $6,601 | $26,492 | $5,726 | $20,766 |
| 2022 | $6,601 | $28,455 | $5,726 | $22,729 |
| 2021 | $5,620 | $22,000 | $3,578 | $18,422 |
| 2020 | $5,541 | $22,000 | $3,578 | $18,422 |
| 2019 | $7,602 | $28,952 | $3,578 | $25,374 |
| 2018 | $7,646 | $26,203 | $3,149 | $23,054 |
| 2017 | $7,557 | $26,203 | $3,149 | $23,054 |
| 2016 | $7,048 | $26,203 | $3,149 | $23,054 |
| 2015 | $6,786 | $22,981 | $2,719 | $20,262 |
| 2014 | $6,587 | $22,981 | $2,719 | $20,262 |
| 2013 | $6,422 | $22,981 | $2,719 | $20,262 |
Source: Public Records
Map
Nearby Homes
- 617 N Wilke Rd
- 827 N Walnut Ave
- 1108 W Miner St
- 421 W Hawthorne St
- 1418 W Saint James Place
- 1136 N Walnut Ave
- 628 S Wilke Rd
- 910 N Chestnut Ave
- 1419 W Miner St
- 1142 N Mitchell Ave
- 1237 N Ridge Ave
- 924 N Highland Ave
- 1326 N Race Ave
- 514 W Miner St Unit 2F
- 543 S Warren Ave
- 24 S Kaspar Ave
- 2207 Eastman St
- 2201 Wren Ln
- 318 W Wing St
- 1317 N Mitchell Ave
- 809 N Princeton Ave
- 803 N Princeton Ave
- 813 N Princeton Ave
- 806 N Harvard Ave
- 810 N Harvard Ave
- 802 N Harvard Ave
- 817 N Princeton Ave
- 814 N Harvard Ave
- 1224 W Northwest Hwy
- 736 N Harvard Ave
- 1220 W Northwest Hwy
- 818 N Harvard Ave
- 821 N Princeton Ave
- 810 N Princeton Ave
- 730 N Harvard Ave
- 814 N Princeton Ave
- 1212 W Northwest Hwy
- 822 N Harvard Ave
- 818 N Princeton Ave