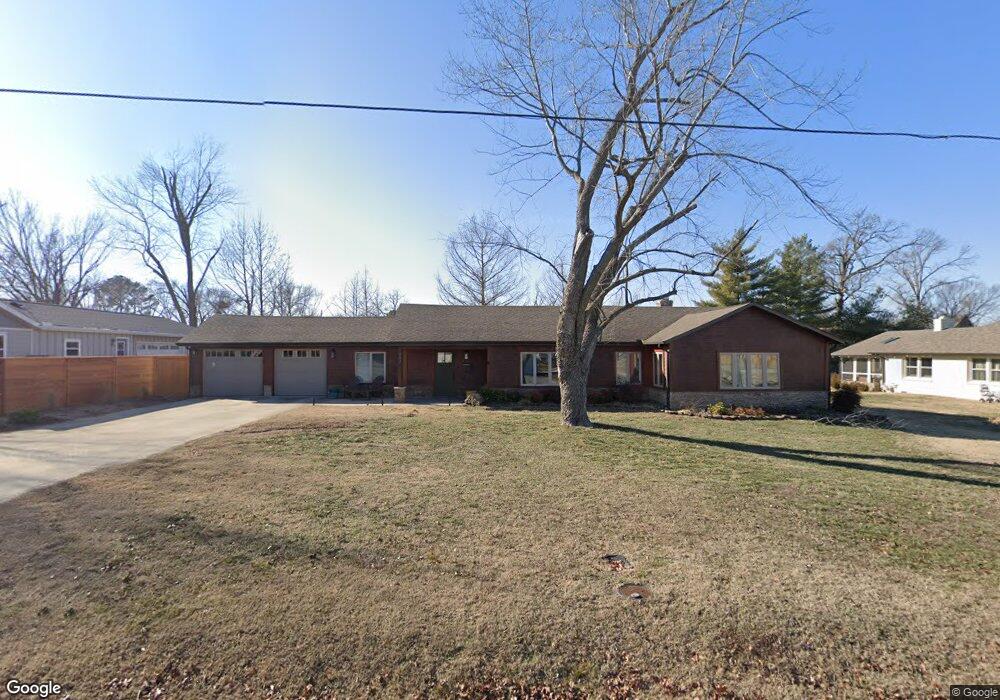
807 NW B St Bentonville, AR 72712
Estimated Value: $849,000 - $1,277,344
3
Beds
1
Bath
1,100
Sq Ft
$974/Sq Ft
Est. Value
About This Home
This home is located at 807 NW B St, Bentonville, AR 72712 and is currently estimated at $1,071,336, approximately $973 per square foot. 807 NW B St is a home located in Benton County with nearby schools including Sugar Creek Elementary School, Lincoln Junior High School, and Old High Middle School.
Ownership History
Date
Name
Owned For
Owner Type
Purchase Details
Closed on
Aug 13, 2012
Sold by
Clark Daniel T
Bought by
Clark Michael W and Clark Lynn L
Current Estimated Value
Purchase Details
Closed on
Jul 19, 2012
Sold by
Clark Michael Wayne and Clark Lynn Lee
Bought by
Clark Michael W and Clark Lynn L
Purchase Details
Closed on
Sep 3, 2008
Sold by
Meeks Robert L
Bought by
Clark Michael W and Clark Lynn L
Purchase Details
Closed on
Jul 16, 1991
Bought by
Meeks
Purchase Details
Closed on
Oct 12, 1984
Bought by
Mason Dennis L and Mason Alice K
Purchase Details
Closed on
Feb 10, 1965
Bought by
Mason Alice
Create a Home Valuation Report for This Property
The Home Valuation Report is an in-depth analysis detailing your home's value as well as a comparison with similar homes in the area
Home Values in the Area
Average Home Value in this Area
Purchase History
| Date | Buyer | Sale Price | Title Company |
|---|---|---|---|
| Clark Michael W | -- | None Available | |
| Clark Michael W | -- | None Available | |
| Clark Michael W | $75,000 | None Available | |
| Meeks | $35,000 | -- | |
| Mason Dennis L | -- | -- | |
| Mason Alice | -- | -- |
Source: Public Records
Tax History Compared to Growth
Tax History
| Year | Tax Paid | Tax Assessment Tax Assessment Total Assessment is a certain percentage of the fair market value that is determined by local assessors to be the total taxable value of land and additions on the property. | Land | Improvement |
|---|---|---|---|---|
| 2025 | $2,426 | $241,731 | $94,340 | $147,391 |
| 2024 | $2,437 | $241,731 | $94,340 | $147,391 |
| 2023 | $2,437 | $103,140 | $64,420 | $38,720 |
| 2022 | $2,122 | $103,140 | $64,420 | $38,720 |
| 2021 | $2,113 | $103,140 | $64,420 | $38,720 |
| 2020 | $2,137 | $45,120 | $3,800 | $41,320 |
| 2019 | $2,137 | $45,120 | $3,800 | $41,320 |
| 2018 | $2,162 | $45,120 | $3,800 | $41,320 |
| 2017 | $2,083 | $45,120 | $3,800 | $41,320 |
| 2016 | $2,083 | $45,120 | $3,800 | $41,320 |
| 2015 | $2,437 | $39,440 | $4,000 | $35,440 |
| 2014 | $764 | $20,520 | $4,000 | $16,520 |
Source: Public Records
Map
Nearby Homes