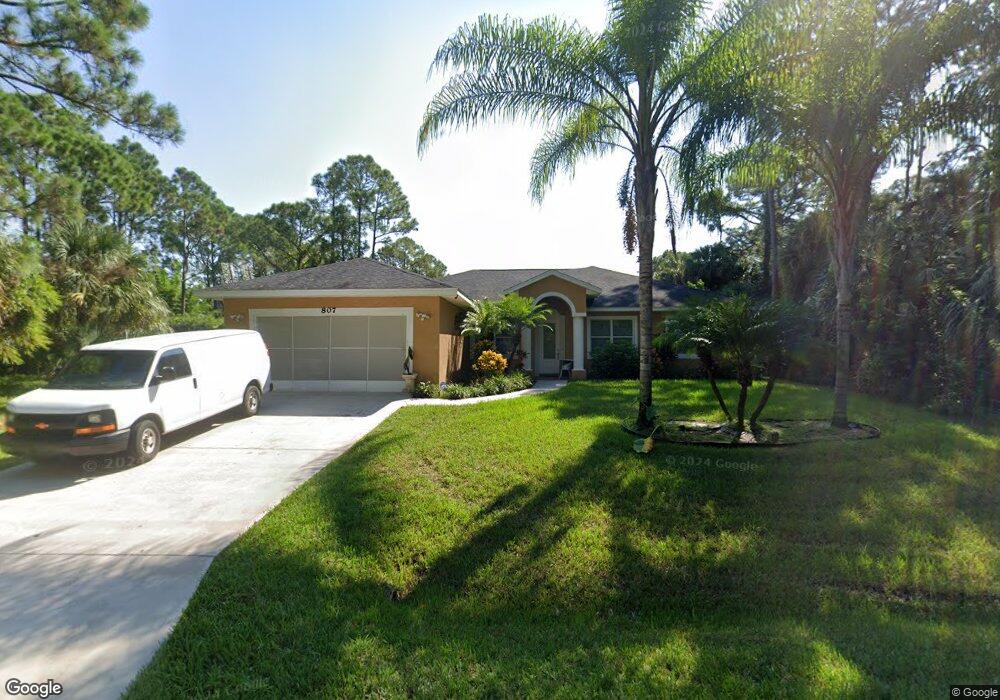
807 Peyton Ave SW Palm Bay, FL 32908
Estimated Value: $369,000 - $456,000
3
Beds
3
Baths
2,219
Sq Ft
$188/Sq Ft
Est. Value
About This Home
This home is located at 807 Peyton Ave SW, Palm Bay, FL 32908 and is currently estimated at $416,622, approximately $187 per square foot. 807 Peyton Ave SW is a home located in Brevard County with nearby schools including Jupiter Elementary School, Central Middle School, and Heritage High School.
Ownership History
Date
Name
Owned For
Owner Type
Purchase Details
Closed on
Aug 28, 2017
Sold by
Howell Paulette and Howell Isaac
Bought by
Howell Isaac
Current Estimated Value
Purchase Details
Closed on
Apr 4, 2013
Sold by
Howell Isaac and Howell Kevin
Bought by
Howell Isaac and Howell Paulette
Purchase Details
Closed on
Apr 13, 2009
Sold by
Tharpe Anthony
Bought by
Careif Limited
Purchase Details
Closed on
Apr 9, 2009
Sold by
Careif Limited
Bought by
Howell Isaac and Howell Kevin K
Purchase Details
Closed on
Dec 17, 2005
Sold by
Tharpe Anthony
Bought by
Careif Ltd
Purchase Details
Closed on
Jun 18, 2003
Sold by
Reid Mark
Bought by
Thampe Anthony
Purchase Details
Closed on
May 13, 2003
Sold by
National Lots Inc
Bought by
Reid Mark
Purchase Details
Closed on
Mar 3, 2003
Sold by
Callicott Lanny Horace and Callicott Patricia Denton
Bought by
Natl Lots Inc
Create a Home Valuation Report for This Property
The Home Valuation Report is an in-depth analysis detailing your home's value as well as a comparison with similar homes in the area
Home Values in the Area
Average Home Value in this Area
Purchase History
| Date | Buyer | Sale Price | Title Company |
|---|---|---|---|
| Howell Isaac | -- | Attorney | |
| Howell Isaac | -- | Attorney | |
| Howell Isaac | -- | Attorney | |
| Howell Isaac | -- | None Available | |
| Careif Limited | -- | Peninsula Title Services Llc | |
| Howell Isaac | $7,000 | Peninsula Title Services Llc | |
| Careif Ltd | -- | -- | |
| Thampe Anthony | -- | -- | |
| Reid Mark | $4,900 | Fidelity National Title Insu | |
| Natl Lots Inc | $1,000 | -- |
Source: Public Records
Tax History Compared to Growth
Tax History
| Year | Tax Paid | Tax Assessment Tax Assessment Total Assessment is a certain percentage of the fair market value that is determined by local assessors to be the total taxable value of land and additions on the property. | Land | Improvement |
|---|---|---|---|---|
| 2025 | $2,777 | $193,950 | -- | -- |
| 2024 | $2,710 | $188,490 | -- | -- |
| 2023 | $2,710 | $183,000 | $0 | $0 |
| 2022 | $2,608 | $177,670 | $0 | $0 |
| 2021 | $2,666 | $172,500 | $0 | $0 |
| 2020 | $2,613 | $170,120 | $0 | $0 |
| 2019 | $2,836 | $166,300 | $0 | $0 |
| 2018 | $2,770 | $213,270 | $16,500 | $196,770 |
| 2017 | $2,799 | $159,850 | $0 | $0 |
| 2016 | $2,557 | $156,570 | $13,500 | $143,070 |
| 2015 | $2,410 | $146,550 | $4,500 | $142,050 |
| 2014 | $145 | $3,700 | $3,700 | $0 |
Source: Public Records
Map
Nearby Homes
- 1220 Hastings Rd SW
- 724 Hartsdale Ave SW
- 1200&1206 Hastings Rd SW
- 1210 Hastings Rd SW
- 1226 Hastings Rd SW
- 743 Griffin Ave
- 867 Peyton Ave SW
- 801 Dartmouth Ave SW
- 1275 Hastings Rd SW
- 1274 Landau Rd SW
- 1280 Hastings Rd SW
- 0 Unknown Ave SW Unit 1018772
- 1324 Gibralter St SW
- 1370 Seabreeze St SW
- 1320 Seabreeze St SW
- 1350 Seabreeze St SW
- 1259 Hathaway Rd SW
- 1349 Gibbs Rd SW
- 891 Hartsdale Ave SW
- 1271 Hathaway Rd SW
- 806 Rebus Ave SW
- 812 Rebus Ave SW
- 834 Peyton Ave
- 826 Peyton Ave
- 818 Peyton Ave
- 812 Peyton Ave
- 850 Peyton Ave
- 858 Peyton Ave
- 801 Rebus Ave
- 882 Rebus Ave
- 899 Rebus Ave
- 0000 Rebus Ave
- 819 SW Peyton Ave
- 801 Rebus (Corner of Harper) Ave SW
- 1237 Harper Blvd SW
- 813 Rebus Ave SW
- 826 Rebus Ave
- 1185 Harper Blvd SW
- 818 Rebus Ave SW
- 819 Rebus Ave SW