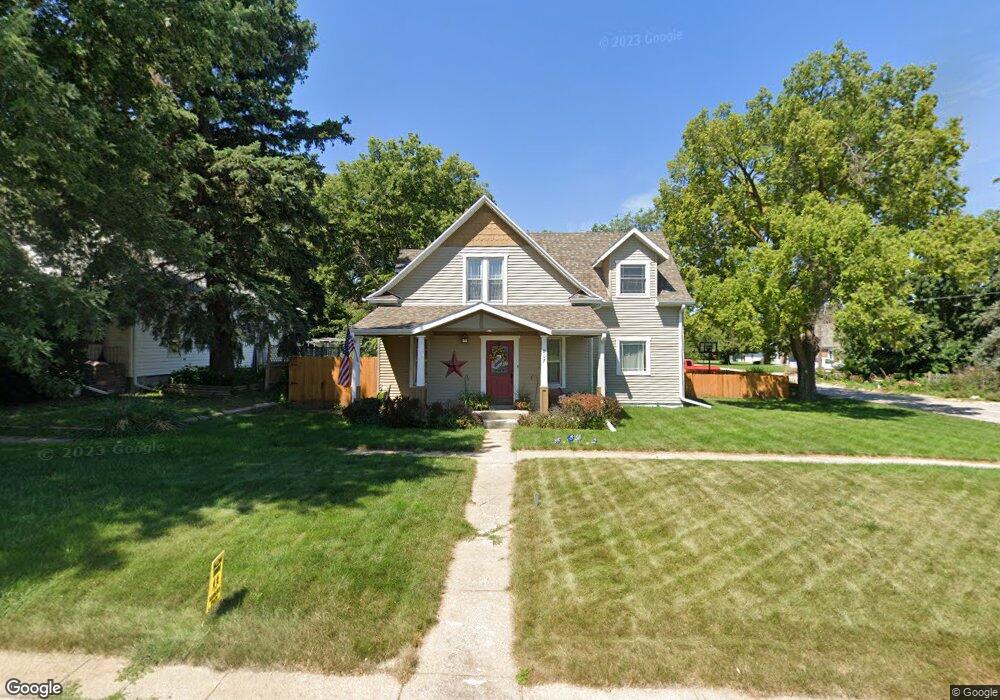
807 S 10th Ave Broken Bow, NE 68822
Estimated Value: $188,000 - $252,677
--
Bed
2
Baths
1,777
Sq Ft
$118/Sq Ft
Est. Value
About This Home
This home is located at 807 S 10th Ave, Broken Bow, NE 68822 and is currently estimated at $210,419, approximately $118 per square foot. 807 S 10th Ave is a home located in Custer County with nearby schools including North Park Elementary School, Broken Bow Junior High School, and Broken Bow High School.
Ownership History
Date
Name
Owned For
Owner Type
Purchase Details
Closed on
Jul 23, 2014
Sold by
Mcalexander Ryan D and Mcalexander Sandra M
Bought by
Coufal Luke Charles and Coufal Nancee
Current Estimated Value
Purchase Details
Closed on
Jun 20, 2007
Sold by
Sampson Caleb M and Sampson Kristin L
Bought by
Mcalexander Ryan D and Mcalexander Sandra M
Purchase Details
Closed on
Sep 14, 2006
Sold by
Jilg Construction Inc
Bought by
Sampson Caleb M and Sampson Kristin L
Purchase Details
Closed on
Aug 4, 2005
Sold by
Douglass Donald J
Bought by
Jilg Construction Inc
Create a Home Valuation Report for This Property
The Home Valuation Report is an in-depth analysis detailing your home's value as well as a comparison with similar homes in the area
Home Values in the Area
Average Home Value in this Area
Purchase History
| Date | Buyer | Sale Price | Title Company |
|---|---|---|---|
| Coufal Luke Charles | $169,000 | -- | |
| Mcalexander Ryan D | $157,500 | -- | |
| Sampson Caleb M | $142,000 | -- | |
| Jilg Construction Inc | $16,500 | -- |
Source: Public Records
Tax History Compared to Growth
Tax History
| Year | Tax Paid | Tax Assessment Tax Assessment Total Assessment is a certain percentage of the fair market value that is determined by local assessors to be the total taxable value of land and additions on the property. | Land | Improvement |
|---|---|---|---|---|
| 2025 | $2,861 | $230,060 | $10,752 | $219,308 |
| 2024 | $2,861 | $210,153 | $10,752 | $199,401 |
| 2023 | $3,101 | $197,958 | $10,752 | $187,206 |
| 2022 | $3,430 | $186,904 | $10,752 | $176,152 |
| 2021 | $3,341 | $186,232 | $10,080 | $176,152 |
| 2020 | $3,312 | $186,232 | $10,080 | $176,152 |
| 2019 | $2,967 | $167,129 | $5,041 | $162,088 |
| 2017 | $2,793 | $152,922 | $5,041 | $147,881 |
| 2016 | $3,021 | $151,174 | $3,293 | $147,881 |
| 2015 | $2,921 | $144,917 | $3,251 | $141,666 |
| 2014 | $2,921 | $131,742 | $2,955 | $128,787 |
Source: Public Records
Map
Nearby Homes