Estimated Value: $400,000 - $429,000
3
Beds
3
Baths
1,528
Sq Ft
$273/Sq Ft
Est. Value
About This Home
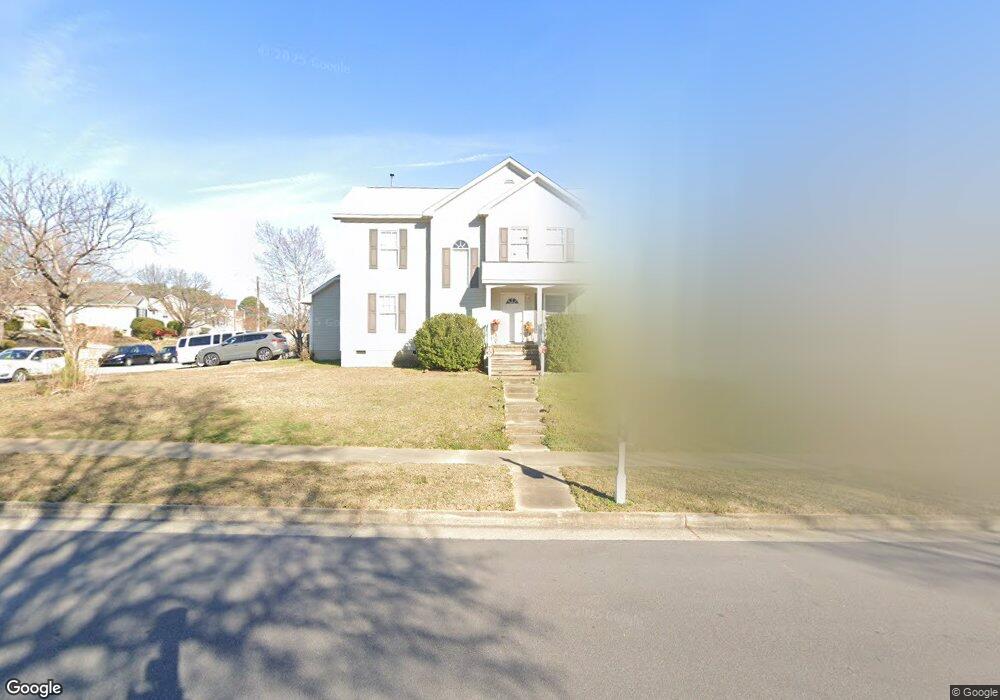
This home is located at 807 Shackleton Rd, Apex, NC 27502 and is currently estimated at $416,511, approximately $272 per square foot. 807 Shackleton Rd is a home located in Wake County with nearby schools including Apex Elementary School, Apex Middle, and Apex High School.
Ownership History
Date
Name
Owned For
Owner Type
Purchase Details
Closed on
Sep 26, 2011
Sold by
Romano David and Pell Judy B
Bought by
Romano David and Pell Judy B
Current Estimated Value
Home Financials for this Owner
Home Financials are based on the most recent Mortgage that was taken out on this home.
Original Mortgage
$61,625
Outstanding Balance
$42,434
Interest Rate
4.3%
Mortgage Type
New Conventional
Estimated Equity
$374,077
Purchase Details
Closed on
Oct 5, 2006
Sold by
Fox Thomas James
Bought by
Romano David
Home Financials for this Owner
Home Financials are based on the most recent Mortgage that was taken out on this home.
Original Mortgage
$127,400
Outstanding Balance
$76,022
Interest Rate
6.46%
Mortgage Type
Purchase Money Mortgage
Estimated Equity
$340,489
Purchase Details
Closed on
Jun 29, 2001
Sold by
Stclair Michael E and Stclair Michelle L
Bought by
Fox Thomas James
Home Financials for this Owner
Home Financials are based on the most recent Mortgage that was taken out on this home.
Original Mortgage
$147,747
Interest Rate
7.37%
Create a Home Valuation Report for This Property
The Home Valuation Report is an in-depth analysis detailing your home's value as well as a comparison with similar homes in the area
Purchase History
| Date | Buyer | Sale Price | Title Company |
|---|---|---|---|
| Romano David | -- | None Available | |
| Romano David | $170,000 | None Available | |
| Fox Thomas James | $145,000 | -- |
Source: Public Records
Mortgage History
| Date | Status | Borrower | Loan Amount |
|---|---|---|---|
| Open | Romano David | $61,625 | |
| Open | Romano David | $127,400 | |
| Previous Owner | Fox Thomas James | $147,747 |
Source: Public Records
Tax History
| Year | Tax Paid | Tax Assessment Tax Assessment Total Assessment is a certain percentage of the fair market value that is determined by local assessors to be the total taxable value of land and additions on the property. | Land | Improvement |
|---|---|---|---|---|
| 2025 | $3,756 | $427,954 | $190,000 | $237,954 |
| 2024 | $3,673 | $427,954 | $190,000 | $237,954 |
Source: Public Records
Map
Nearby Homes
- 318 Glaston Ct
- 101 Harbor Haven Dr
- 1039 Dual Parks Rd
- 110 Anterbury Dr
- 0-2932 Tingen Rd
- 1750 Minley Way
- 1434 Salem Creek Dr
- 305 Anterbury Dr
- 1614 Brussels Dr
- 314 Wrenn St
- 736 Treviso Ln
- 203 Milky Way Dr
- 307 S Elm St
- 102 Licorice Dr
- 120 Licorice Dr
- 810 Bryn Mawr Ct
- 111 Lemon Drop Cir
- 105 Cunningham St
- 909 Bryn Mawr Ct
- 1639 Padstone Dr
- 809 Shackleton Rd
- 302 Estate Dr
- 301 Estate Dr
- 811 Shackleton Rd
- 304 Estate Dr
- 803 Shackleton Rd
- 806 Shackleton Rd
- 808 Shackleton Rd
- 303 Estate Dr
- 303 Interior Ct
- 804 Shackleton Rd
- 810 Shackleton Rd
- 305 Estate Dr
- 813 Shackleton Rd
- 305 Interior Ct
- 802 Teulon Way
- 800 Shackleton Rd
- 300 Sparta Ln
- 812 Shackleton Rd
- 307 Estate Dr
Your Personal Tour Guide
Ask me questions while you tour the home.