Estimated Value: $122,000 - $161,000
Studio
--
Bath
1,374
Sq Ft
$103/Sq Ft
Est. Value
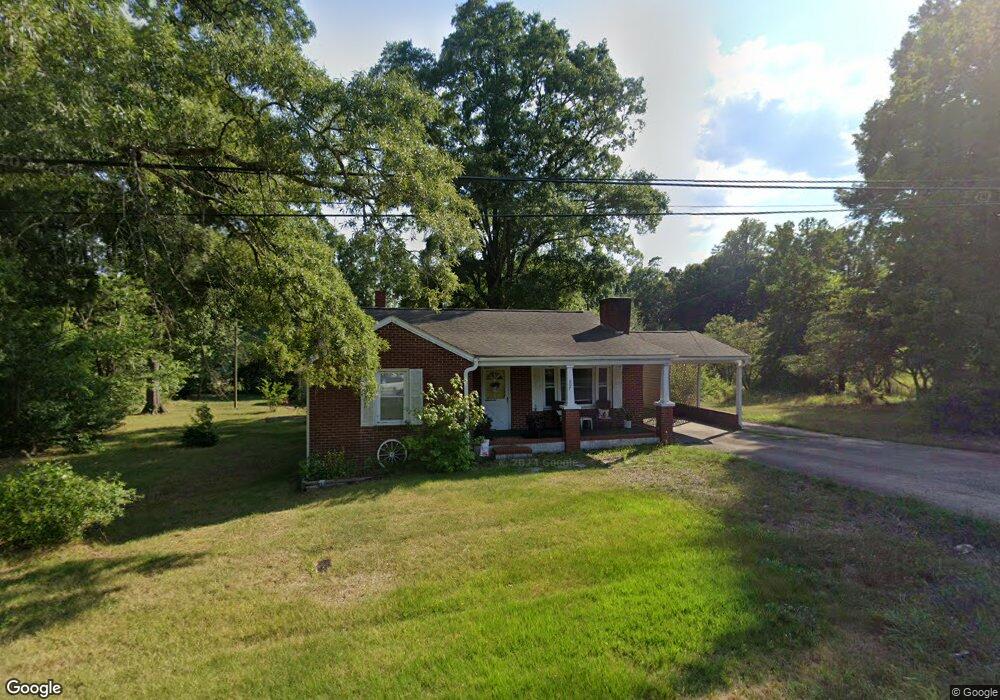
About This Home
This home is located at 807 Summit Rd, Eden, NC 27288 and is currently estimated at $140,853, approximately $102 per square foot. 807 Summit Rd is a home located in Rockingham County with nearby schools including Central Elementary School, J.E. Holmes Middle School, and John M. Morehead High School.
Ownership History
Date
Name
Owned For
Owner Type
Purchase Details
Closed on
Dec 1, 2014
Sold by
Allen Donald Love and Allen Teresa C
Bought by
Jones James Edward
Current Estimated Value
Home Financials for this Owner
Home Financials are based on the most recent Mortgage that was taken out on this home.
Original Mortgage
$48,000
Outstanding Balance
$36,997
Interest Rate
4.09%
Mortgage Type
Future Advance Clause Open End Mortgage
Estimated Equity
$103,856
Purchase Details
Closed on
Feb 24, 2009
Sold by
Allen Oscar Love
Bought by
Gelinas Debra A and Mcdonald Gay A
Create a Home Valuation Report for This Property
The Home Valuation Report is an in-depth analysis detailing your home's value as well as a comparison with similar homes in the area
Home Values in the Area
Average Home Value in this Area
Purchase History
| Date | Buyer | Sale Price | Title Company |
|---|---|---|---|
| Jones James Edward | $60,000 | None Available | |
| Gelinas Debra A | -- | None Available |
Source: Public Records
Mortgage History
| Date | Status | Borrower | Loan Amount |
|---|---|---|---|
| Open | Jones James Edward | $48,000 |
Source: Public Records
Tax History
| Year | Tax Paid | Tax Assessment Tax Assessment Total Assessment is a certain percentage of the fair market value that is determined by local assessors to be the total taxable value of land and additions on the property. | Land | Improvement |
|---|---|---|---|---|
| 2025 | $1,166 | $105,995 | $13,989 | $92,006 |
| 2024 | $1,166 | $105,995 | $13,989 | $92,006 |
| 2023 | $1,166 | $65,862 | $7,934 | $57,928 |
| 2022 | $859 | $65,862 | $7,934 | $57,928 |
| 2021 | $859 | $65,862 | $7,934 | $57,928 |
| 2020 | $859 | $65,862 | $7,934 | $57,928 |
| 2019 | $859 | $65,862 | $7,934 | $57,928 |
| 2018 | $891 | $68,300 | $12,896 | $55,404 |
| 2017 | $891 | $68,300 | $12,896 | $55,404 |
| 2015 | $900 | $68,300 | $12,896 | $55,404 |
| 2014 | $462 | $68,300 | $12,896 | $55,404 |
Source: Public Records
Map
Nearby Homes
- 826 Summit Rd
- 912 Friendly Rd
- 00 Summit Rd
- 626 Creekridge Dr
- 737 Summit Rd
- 729 Cypress Hill Dr
- 401 Sherwood Ct
- 621 North St
- 516 John St
- 183 E Aiken Rd
- 332 Wilshire Dr
- 334 Wilshire Dr
- 328 Wilshire Dr
- 216 Roosevelt St
- 607 Truman St
- 341 Wilshire Dr
- 327 Wilshire Dr
- 416 Regency Ln
- 420 Regency Ln
- 424 Regency Ln
Your Personal Tour Guide
Ask me questions while you tour the home.